

Overview
In this project, we will build our own Thermal Camera with Raspberry Pi & AMG8833 Thermal Image Array Temperature Sensor. Earlier we build a Thermal Camera using ESP8266 & AMG8833 which was quite popular.
Thermal cameras are widely used for a variety of applications such as detecting temperature anomalies, monitoring thermal performance, and even capturing thermal images. However, these cameras can be quite expensive, and not everyone has access to them. But what if you could build your own thermal camera using affordable components such as the Raspberry Pi and the AMG8833 thermal image array temperature sensor? This is exactly what this article is about!
Building a thermal camera using the Raspberry Pi and the AMG8833 thermal image array temperature sensor is a fun and affordable project that can be done by anyone with basic electronic skills. Whether you want to monitor temperature anomalies in your home, detect heat leaks in your walls, or simply capture thermal images, this project is a great way to get started. To build a High Resolution Thermal Camera you may use MLX90640 32×24 Thermal Image Array Temperature sensor.
Bill of Materials
We need the following components for this project. You can purchase the components from the given links.
| S.N. | Components | Quantity | Purchase Link |
|---|---|---|---|
| 1 | Raspberry Pi 4 | 1 | Amazon | SunFounder |
| 2 | AMG8833 Thermal Image Sensor | 1 | Amazon | AliExpress |
| 3 | TS-Pro 7 inch LCD Display | 1 | Amazon | SunFounder |
| 4 | SD Card 16/32 GB | 1 | Amazon | SunFounder |
| 5 | 5V, 3A DC Adapter for RPi | 1 | Amazon | SunFounder |
| 6 | Mouse & Keyboard (Optional) | 1 | Amazon | SunFounder |
What is Thermal Imaging Camera & how they work?
A thermal imaging camera is a device that detects and displays temperature patterns in the form of an image.

It works by measuring the infrared radiation emitted by objects and translating that information into a visual image that shows relative differences in temperature. This allows you to see objects, structures, and areas that may be too hot or cold and identify issues that could not be seen with the naked eye.

Thermal imaging cameras work by detecting the infrared radiation emitted by objects and translating that information into a visual image. Here’s how the process works in detail:
- Infrared detection: The camera’s sensor, either a thermopile or a microbolometer, detects the infrared radiation emitted by objects in its field of view. The amount of radiation detected depends on the temperature of the object.
- Conversion to electrical signal: The sensor converts the detected infrared radiation into a measurable electrical signal. This signal is proportional to the temperature of the object and is used to create the thermal image.
- Image processing: The electrical signal is processed by the camera’s image processor, which translates the signal into an image that displays relative differences in temperature. The image processor also enhances the image by applying various filters, such as color palettes and brightness and contrast adjustments, to make the thermal information more easily understood.
- Display: The final thermal image is displayed on the camera’s screen, where you can see the temperature patterns of objects in the image. The hotter the object, the brighter it appears in the image.
AMG8833 8×8 IR Thermal Camera Sensor
AMG8833 is a simple thermal camera module from Panasonic, also known as a temperature monitoring device. It divides captured data into 64 blocks of 8×8, giving it a resolution of 8×8 or 64 pixels. Each pixel acts as an individual IR sensor, providing a separate temperature measurement, making this sensor better than PIR and pyrometric sensors that only offer one temperature value.

The AMG8833 features a built-in lens that restricts its viewing angle to 60 degrees, making it ideal for detecting objects in the mid-field. It operates at a voltage of 3.3V or 5V, with a sample rate of 1Hz to 10Hz. Its temperature resolution is approximately 0.25°C and it can detect temperatures within a range of 0°C to 80°C.

Compared to visible imaging cameras, the AMG8833 has a narrow field of view (60×60 sq. deg) and a low resolution of 64 pixels, but is costlier, at around $40-50. On the other hand, a Raspberry Pi camera with a 5MPx resolution, which is 100 times more, costs only $10-15.
The cost of thermal cameras is mainly due to the lens and circuitry, as they detect IR waves of 8-14um, which requires expensive materials like germanium or chalcogenides to be used. Additionally, extra care has to be taken to prevent camera temperature from affecting readings, making it a radiometric thermal camera. The size and heat dissipation of the camera array also add to the cost.
However, with advancements in materials and techniques, thermal cameras have become more affordable and user-friendly, and are available as I2C sensors or USB cameras.
AMG8833 Features & Specifications
- Infrared thermal imaging sensor with an 8×8 array of thermopiles
- Detects temperature differences as small as 0.01°C
- Digital output with I2C interface
- Supports up to 64 temperature measurements
- Operating temperature range: -40°C to +85°C
- Supply voltage: 2.7 V to 3.3 V
- Operating current: 120 mA
- Resolution: 8×8 pixels
- Field of view: 55° (H) x 55° (V)
- Operating temperature range: -40°C to +85°C
- Frame rate: 10 frames per second
AMG8833 Pinout
The AMG8833 infrared thermal imaging sensor has 6 pins:

- VIN: Power supply voltage input (2.7V to 3.3V)
- GND: Ground
- SCL: I2C clock line
- SDA: I2C data line
- INT: Interrupt output (active low)
- AD0: I2C address selection pin (low for 0x69, high for 0x68)
Setting Up AMG8833 Thermal Camera Sensor with Raspberry Pi 4
Now let us interface and setup AMG8833 Thermal Camera Imaging Sensor with Raspberry Pi 4 & 7-inch LCD Display. The specific model of Raspberry Pi used is not a crucial factor, however, for testing purposes, we selected the Raspberry Pi 4 Model B. This was due to its faster processor, which leads to quicker real-time visualization results.
We could have done this project using Arduino Board, however, displaying images with a single script or embedded device can be challenging. To visualize the images, a desktop system such as the Processing IDE or using python is necessary. With 64 sensor values, uploading the data to a server like Arduino IOT Cloud, ThingSpeak, Ubidots, or Blynk is not sufficient. That’s why I opted for a Raspberry Pi, which allows me to process my images using python.
For visualizing thermal images, a 7-inch LCD display is employed as using a VNC Viewer or any other server results in slow visualization with delayed response times.
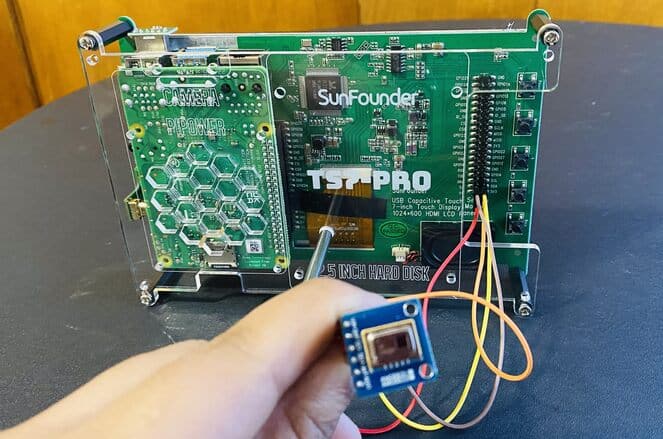
Circuit Diagram & Connnections
The connection process is straightforward, requiring only four wires. Simply connect the VCC, GND, SDA, and SCL pins of the AMG8833 to the corresponding VCC, GND, SDA, and SCL pins of the Raspberry Pi.

It is important to keep in mind that the wiring diagram for the AMG8833 sets its I2C address to 0x69, based on the ADO pin being connected to VIN. However, if the ADO pin on the AMG8833 is connected to GND, the I2C address changes to 0x68.
7-inch LCD Display for Visualization
For the Thermal Images visualization, we will use a TS-7 Pro 7-inch LCD Display from SunFounder.

The 7-inch touchscreen display is a convenient and user-friendly device that can be used in conjunction with a Raspberry Pi. Equipped with dual-channel speakers and a protective cover and stand, it provides high-definition viewing and portability.

Its built-in buttons allow for easy adjustments to volume and brightness, as well as the ability to turn the screen on and off. Key specifications include a 7-inch display with a resolution of 1024×600 pixels, a working voltage of DC 5V, and a rated power of 3.5W. The touch screen features 5-point touch control and is plug-and-play, with a refresh rate of 60Hz. The external dimensions measure 165x114x40mm (excluding the height of the metal support, which is 55mm).
To learn about how to use & setup this display, follow the following Guide:
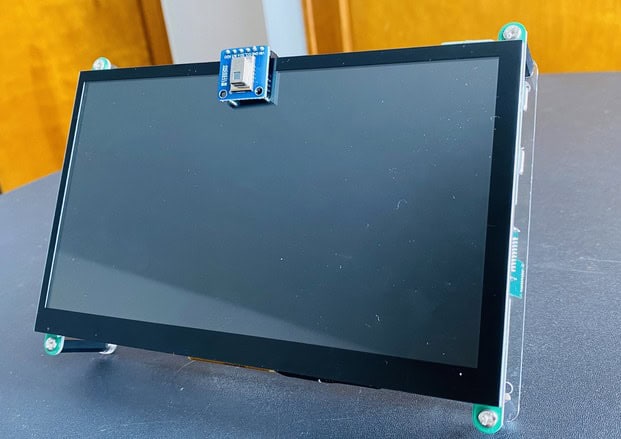
On the backside the connection is fairly simple and the display has a supportive base for placing it on a table or any surface.
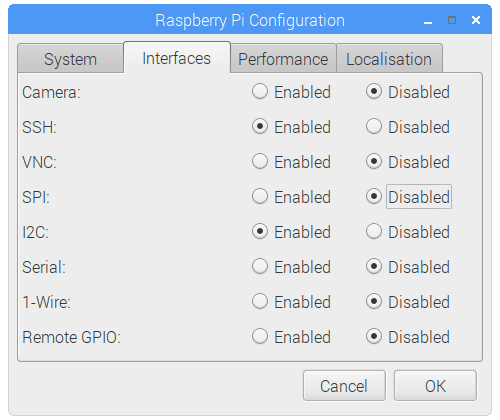
Setting Up Raspberry Pi I2C Communication & Sampling Rate
The set of commands listed below activates the I2C port on the Raspberry Pi and confirms that the AMG8833 is correctly connected to the RPi. Communication between the AMG8833 and Raspberry Pi will be established using the I2C protocol. To enable data reading and writing through I2C, it’s necessary to activate the I2C ports on the RPi. This can be done either by using the command line or by going to Preferences → Raspberry Pi Configuration.
|
1 2 |
sudo apt-get install -y python-smbus sudo apt-get install -y i2c-tools |
Next, enable I2C on the Raspberry Pi 4. For that go to Preferences → Raspberry Pi Configuration.
To find out whether AMG8833 is able to communicate with Raspberry Pi or not, Open Command Window and type the following command:
|
1 |
sudo i2cdetect -y 1 |
The command window should display the 0x69 as an I2C address.
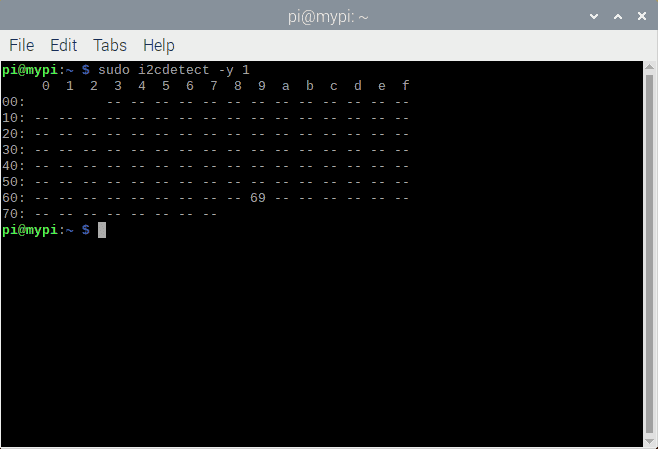
The “i2cdetect” command verifies the proper wiring of the AMG8833 to the Raspberry Pi via I2C. To set the I2C clock frequency at 400kHz for AMG8833 communication, open the terminal on the RPi and access the boot file by typing a command.
|
1 |
sudo nano /boot/config.txt |
In this file add the following lines and save it.
|
1 |
dtparam=12c_arm=on, i2c_arm_baudrate=400000 |
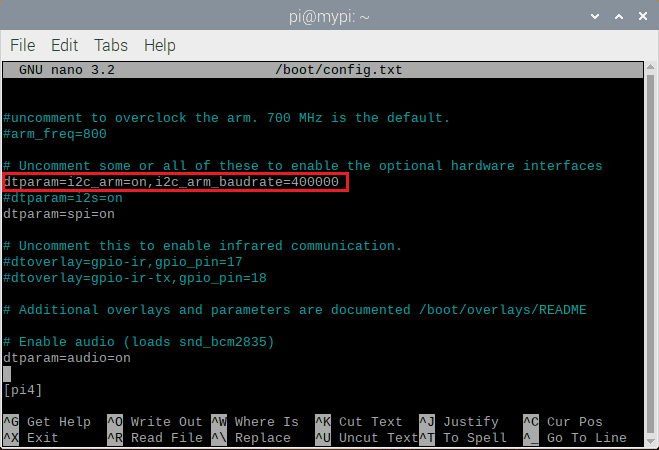
Setting the frequency to 400kHz optimizes the AMG8833’s sample rate, which can be configured up to 10 samples per second (10sps, 10Hz).
Raspberry Pi Python Code for AMG8833 Image Visualization
Now let us go to the program part. The program will give the output Thermal image of 64 pixels in total.
Library Installation
Before jumping to the code part, let’s set up some Python libraries.
The Python library for GRID-EYE® INFRARED ARRAY SENSOR uses the datasheet from Panasonic for complete information on communicating and configuring the AMG8833 sensor. The AMG8833 Datasheet is a brief version of the datasheet and provides information on limits, ratings, and performance. The library combines Adafruit packages for their AMG8833 boards.
First download and install packages outlined in Adafruit guide:
|
1 2 3 4 5 |
sudo apt-get update sudo apt-get install build-essential python-pip python-dev python-smbus git git clone https://github.com/adafruit/Adafruit_Python_GPIO.git cd Adafruit_Python_GPIO sudo python setup.py install |
Run the following script to Install pygame and scipy
|
1 2 |
sudo apt-get install -y python-scipy python-pygame sudo pip install colour Adafruit_AMG88xx |
Finally run the example script
|
1 2 3 4 5 6 |
cd ~/ git clone https://github.com/adafruit/Adafruit_AMG88xx_python cd Adafruit_AMG88xx_python/examples sudo python thermal_cam.py |
Final Python Code
|
1 2 3 4 5 6 7 8 9 10 11 12 13 14 15 16 17 18 19 20 21 22 23 24 25 26 27 28 29 30 31 32 33 34 35 36 37 38 39 40 41 42 43 44 45 46 47 48 49 50 51 52 53 54 55 56 57 58 59 60 61 62 63 64 65 66 67 68 69 70 71 72 73 74 75 76 77 78 |
from Adafruit_AMG88xx import Adafruit_AMG88xx import pygame import os import math import time import numpy as np from scipy.interpolate import griddata from colour import Color #low range of the sensor (this will be blue on the screen) MINTEMP = 26 #high range of the sensor (this will be red on the screen) MAXTEMP = 32 #how many color values we can have COLORDEPTH = 1024 os.putenv('SDL_FBDEV', '/dev/fb1') pygame.init() #initialize the sensor sensor = Adafruit_AMG88xx() points = [(math.floor(ix / 8), (ix % 8)) for ix in range(0, 64)] grid_x, grid_y = np.mgrid[0:7:32j, 0:7:32j] #sensor is an 8x8 grid so lets do a square height = 240 width = 240 #the list of colors we can choose from blue = Color("indigo") colors = list(blue.range_to(Color("red"), COLORDEPTH)) #create the array of colors colors = [(int(c.red * 255), int(c.green * 255), int(c.blue * 255)) for c in colors] displayPixelWidth = width / 30 displayPixelHeight = height / 30 lcd = pygame.display.set_mode((width, height)) lcd.fill((255,0,0)) pygame.display.update() pygame.mouse.set_visible(False) lcd.fill((0,0,0)) pygame.display.update() #some utility functions def constrain(val, min_val, max_val): return min(max_val, max(min_val, val)) def map(x, in_min, in_max, out_min, out_max): return (x - in_min) * (out_max - out_min) / (in_max - in_min) + out_min #let the sensor initialize time.sleep(.1) while(1): #read the pixels pixels = sensor.readPixels() pixels = [map(p, MINTEMP, MAXTEMP, 0, COLORDEPTH - 1) for p in pixels] #perdorm interpolation bicubic = griddata(points, pixels, (grid_x, grid_y), method='cubic') #draw everything for ix, row in enumerate(bicubic): for jx, pixel in enumerate(row): pygame.draw.rect(lcd, colors[constrain(int(pixel), 0, COLORDEPTH- 1)], (displayPixelHeight * ix, displayPixelWidth * jx, displayPixelHeight, displayPixelWidth)) pygame.display.update() |
Code Explanation
- Importing libraries:
|
1 2 3 4 5 6 7 8 9 10 |
from Adafruit_AMG88xx import Adafruit_AMG88xx import pygame import os import math import time import numpy as np from scipy.interpolate import griddata from colour import Color |
The script starts by importing various libraries. Adafruit_AMG88xx is a library for the Adafruit AMG88xx grid-eye thermal imaging sensor. Pygame is a library for creating games and multimedia applications in Python. Os and math are Python’s built-in libraries. Time is used for adding a delay. Numpy and scipy.interpolate are used for numerical computing. Color is used to generate colors in a range.
- Setting constants:
|
1 2 3 4 5 6 7 8 |
#low range of the sensor (this will be blue on the screen) MINTEMP = 26 #high range of the sensor (this will be red on the screen) MAXTEMP = 32 #how many color values we can have COLORDEPTH = 1024 |
The script then sets three constants that control the range and color depth of the thermal image. MINTEMP and MAXTEMP define the low and high range of the sensor’s temperature readings. COLORDEPTH sets the number of color values available for the thermal image.
- Initializing pygame:
|
1 2 |
os.putenv('SDL_FBDEV', '/dev/fb1') pygame.init() |
The script sets the environment variable SDL_FBDEV to ‘/dev/fb1’ and then initializes pygame.
- Initializing the sensor:
|
1 2 |
#initialize the sensor sensor = Adafruit_AMG88xx() |
The script then initializes the sensor by creating an instance of Adafruit_AMG88xx.
- Creating the grid points:
|
1 2 |
points = [(math.floor(ix / 8), (ix % 8)) for ix in range(0, 64)] grid_x, grid_y = np.mgrid[0:7:32j, 0:7:32j] |
The script then creates a list of points that define the grid of the sensor and creates arrays grid_x and grid_y that define a grid of 32×32 points covering the 8×8 grid of the sensor.
- Setting the screen size:
|
1 2 3 |
#sensor is an 8x8 grid so lets do a square height = 240 width = 240 |
The script sets the height and width of the screen to 240 pixels.
- Initializing variables:
|
1 2 |
blue = Color("indigo") colors = list(blue.range_to(Color("red"), COLORDEPTH)) |
Here, the variable blue is set to a Color object with the value “indigo”. The range_to method is called on the blue object to generate a list of colors between “indigo” and “red”, with COLORDEPTH being the number of colors in the list. This list of colors is stored in the colors variable.
- Creating an array of colors:
|
1 |
colors = [(int(c.red * 255), int(c.green * 255), int(c.blue * 255)) for c in colors] |
In this line, a new list of colors is being created by transforming the red, green, and blue components of each Color object in the colors list. The values are being scaled from 0 to 255 and stored as tuples in the new colors list.
- Setting up the display:
|
1 2 3 4 5 6 7 8 9 10 11 12 |
displayPixelWidth = width / 30 displayPixelHeight = height / 30 lcd = pygame.display.set_mode((width, height)) lcd.fill((255,0,0)) pygame.display.update() pygame.mouse.set_visible(False) lcd.fill((0,0,0)) pygame.display.update() |
In this segment, the width and height of each display pixel are calculated by dividing the width and height variables by 30, respectively. A display window is then created using pygame.display.set_mode with the dimensions (width, height). The display is filled with red color using lcd.fill((255,0,0)) and updated with pygame.display.update(). The mouse visibility is then set to False with pygame.mouse.set_visible(False), and the display is filled with black color and updated again.
- Utility functions:
|
1 2 3 4 5 |
def constrain(val, min_val, max_val): return min(max_val, max(min_val, val)) def map(x, in_min, in_max, out_min, out_max): return (x - in_min) * (out_max - out_min) / (in_max - in_min) + out_min |
Here, two utility functions are defined: constrain and map. The constrain function takes a value val, and minimum and maximum values min_val and max_val, and returns the value if it is within the specified range, or the minimum or maximum value if the value is outside of the range. The map function takes a value x, minimum and maximum input values in_min and in_max, and minimum and maximum output values out_min and out_max, and returns the mapped value.
- Sensor initialization:
|
1 |
time.sleep(.1) |
The time.sleep function is used to wait for 0.1 seconds, allowing the sensor to initialize.
- Loop Part:
|
1 2 3 4 5 6 7 8 9 10 11 12 13 14 15 |
while(1): #read the pixels pixels = sensor.readPixels() pixels = [map(p, MINTEMP, MAXTEMP, 0, COLORDEPTH - 1) for p in pixels] #perdorm interpolation bicubic = griddata(points, pixels, (grid_x, grid_y), method='cubic') #draw everything for ix, row in enumerate(bicubic): for jx, pixel in enumerate(row): pygame.draw.rect(lcd, colors[constrain(int(pixel), 0, COLORDEPTH- 1)], (displayPixelHeight * ix, displayPixelWidth * jx, displayPixelHeight, displayPixelWidth)) pygame.display.update() |
In each iteration of the loop:
- The
sensor.readPixels()function is called to read the temperature values from the sensor and store them in thepixelslist. - The
pixelslist is then processed by themapfunction to map the temperature values from the range[MINTEMP, MAXTEMP]to the range[0, COLORDEPTH - 1]. This is done so that the temperature values can be used as indices into thecolorslist. - Interpolation is performed on the
pixelsvalues using thegriddatafunction from thescipy.interpolatelibrary. This function takes in thepointsandpixelslists as well as a grid of x and y values (grid_xandgrid_y) and returns a two-dimensional array of interpolated values. - The interpolated values are then used to draw rectangles on the Pygame display using the
pygame.draw.rectfunction. The color of each rectangle is determined by looking up the corresponding color in thecolorslist using theconstrainfunction to ensure that the index into the list is valid. - Finally, the
pygame.display.updatefunction is called to update the display with the newly drawn rectangles.
Testing & Visualization of Thermal Camera Images
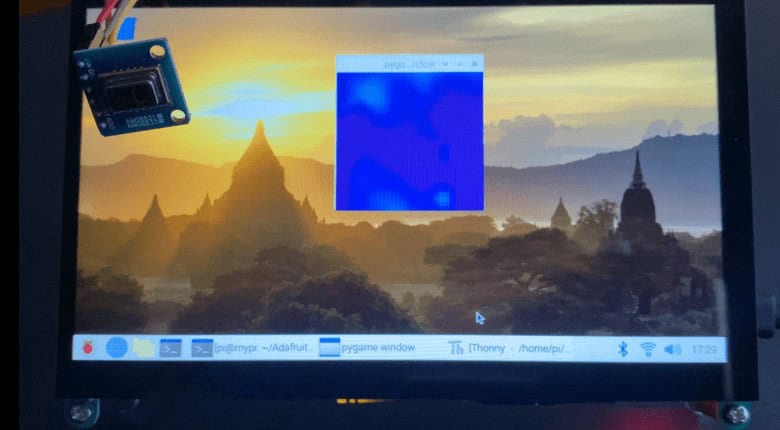
Run the above Python Script and then wait for dialog box to appear.
This dialog box will show the array of 8×8 Thermal Array pixel in 240×240 screen.
If you move your palm and fingers in front of the Camera, the thermal image appears in some dark color on screen. The color depends on the object temperature.
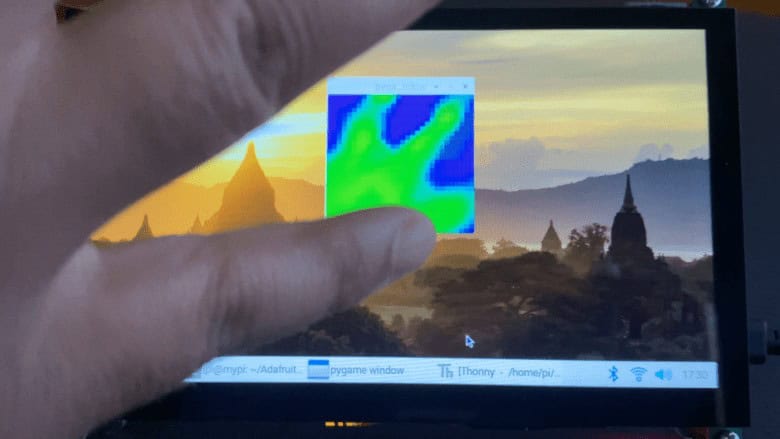
Bring any hot object near or in front of the AMG8833 Thermal Camera, the spot will appear red and displays show the thermal images. For the testing part, you can use the hot Soldering Iron or any hot object.

Video Tutorial & Guide

In conclusion, building a thermal camera with the Raspberry Pi and AMG8833 thermal image array temperature sensor is a unique and exciting project that provides the opportunity for anyone with basic electronics skills to have their own thermal camera.
This DIY project can be used for a wide range of applications, from detecting temperature anomalies to capturing thermal images. With the affordable components and detailed instructions, this project can provide an accessible and educational experience for anyone who wants to try their hand at building their own thermal camera.


1 Comment
I need it