

Overview
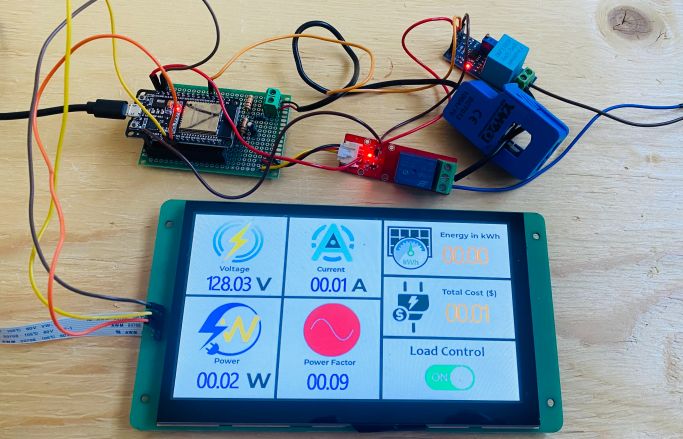
In this project, we will build an IoT Based AC Electricity Energy Meter with ESP32 Microcontroller & HMI Display. The energy meter shows the real-time value of RMS Voltage, Current, Power and Power Factor. It also shows the value of Total Energy consumption in kWh as well as Electricity cost in dollars ($). For visualization we have used a 7-inch HMI Display from DWIN Technology. To monitor the Energy Meter parameter remotely, we upload the Energy Meter data on Blynk dashboard after every 5 seconds.
We can use current sensor (SCT-013) and voltage sensor (ZMPT101B) to build an AC Energy Meter. Earlier we build an IoT Smart Energy Meter using ESP32 & Blynk which could only send voltage, current, power and KWh data to Blynk. But the energy meter was missing some important parameters like cost calculation and HMI Display Data visualization.
This IoT AC Energy Meter does the following tasks:
- Utilizes a 7-inch HMI Display to visualize the voltage, Current, Power, Power Factor, Energy Consumption & Cost.
- Connects the ESP32 to the internet via WiFi and uploads the Energy Meter Data to the Blynk Server
- Calculates the estimated cost of electricity consumed based on a predefined cost per kWh, allowing the user to monitor electricity expenses.
- Uses the EEPROM to store and retrieve the cumulative energy consumption (in kWh) across power cycles, ensuring the persistence of data.
- Features functionality for controlling a Load both from the Blynk app and through HMI Display.
Bill of Materials
To build an IoT AC Energy Meter, we need following components. All the components can be purchased from Amazon or Aliexpress, except the 7-inch HMI LCD Display.
| S.N. | Components | Quantity | Purchase Links |
|---|---|---|---|
| 1 | ESP32 WiFi Module | 1 | Amazon | AliExpress |
| 2 | ZMPT101B AC Voltage Sensor Module | 1 | Amazon | AliExpress |
| 3 | SCT-013-030 Non-invasive AC Current Sensor | 1 | Amazon | AliExpress |
| 4 | 7-inch HDMI Display from DWIN | 1 | dwin-global.com |
| 5 | 1-Channel Relay Module | 1 | Amazon | AliExpress |
| 6 | Micro-USB Cable | 1 | Amazon | AliExpress |
| 7 | Resistor 10K | 2 | Amazon | AliExpress |
| 8 | Resistor 100ohm | 1 | Amazon | AliExpress |
| 9 | Capacitor 10uF | 1 | Amazon | AliExpress |
| 10 | Connecting Wires | 10 | Amazon | AliExpress |
| 11 | Zero-PCB/Vero Board | 1 | Amazon | AliExpress |
SCT-013 Current Sensor
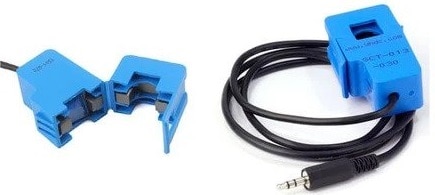
The SCT-013 is a non-invasive split-core type clamp meter sensor designed to measure AC current up to 100 amperes. This type of current sensor is commonly known as a current transformer (CT) and is used for measuring alternating current in a building. The SCT-013 is convenient to use, as it can be easily attached to either the live or neutral wire without any electrical work involving high voltage.
![]()
The sensor has a primary winding, magnetic core, and secondary winding, which is composed of many turns of fine wire enclosed in the transformer casing.
Specifications
1. Input Current: 0-30A AC
2. Output Signal: DC 0-1 V
3. Non-linearity: 2-3 %
4. Build-in sampling resistance (RL): 62 Ω
5. Turn Ratio: 1800:1
6. Resistance Grade: Grade B
7. Work Temperature: -25 °C~+70 °C
8. Dielectric Strength (between shell and output): 1000 V AC / 1 min 5 mA
ZMPT101B AC Single Phase Voltage Sensor

The ZMPT101B AC Single Phase Voltage Sensor Module is a high-precision device built on the ZMPT101B voltage transformer. This makes it an ideal choice for measuring accurate AC voltage with an Arduino or ESP32.
The module is capable of measuring AC voltage within a range of 250V and offers adjustable analog output. It is easy to use, featuring a multi-turn trim potentiometer for adjusting and calibrating the ADC output.
Specifications
1. Voltage up to 250 volts can be measured
2. Lightweight with on-board micro-precision voltage transformer
3. High precision on-board op-amp circuit
4. Operating temperature : 40ºC ~ + 70ºC
5. Supply voltage 5 volts to 30 volts
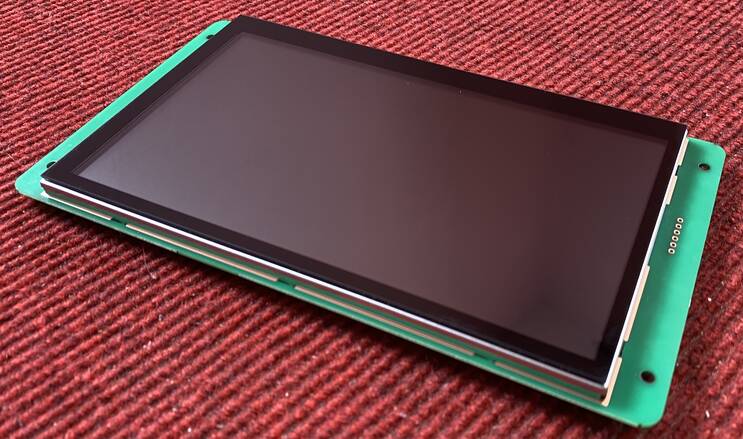
DWIN 7-inch HMI Display (DMG80480C070)
The IoT AC Energy Meter requires an HMI Display for visualization. For this project, we will be using a 7-inch HMI Display from DWIN Technology.
DWIN specializes in making HMI Touch screen displays that are compatible with all microcontrollers like Arduino, ESP32, STM32, PIC, and 8051 families of Microcontrollers. Using the DGUS software you can create UI for your projects that require Touch and visual interactions.
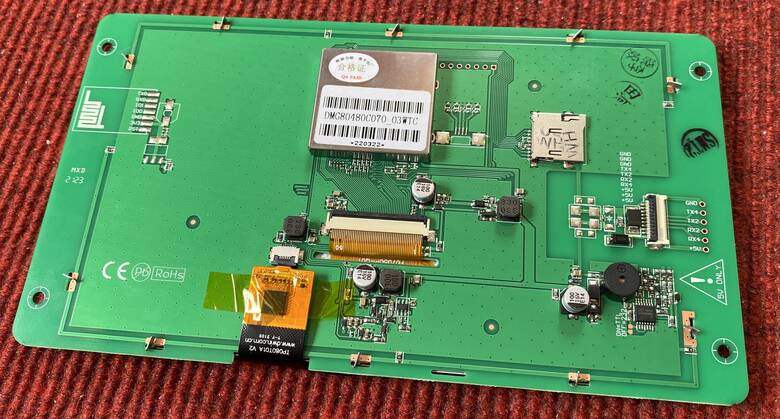
Recently I got this Smart Touch screen TFT-Display from the DWIN. The model of the display that I got is DMG80480C070. The DWIN 7-inch HMI LCD Display is a versatile, commercial-grade display module based on the T5L0 chip and running the DGUS II system. It features a 7.0-inch TFT LCD with a resolution of 800×480 pixels, supporting 262K colors, and offers various touchscreen options including none, resistive, or capacitive.
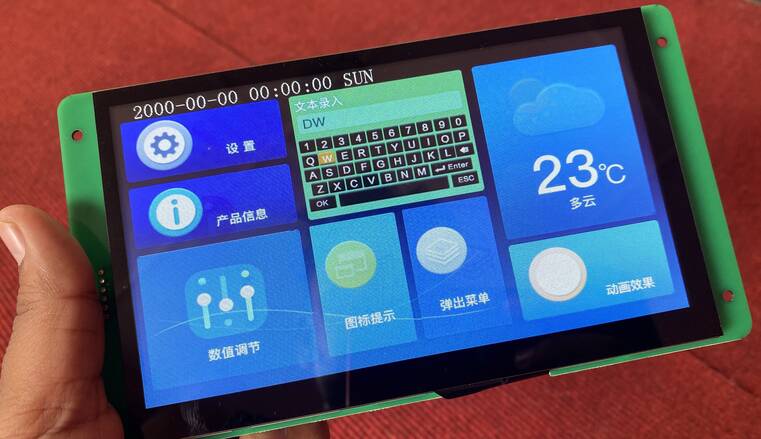
It’s designed for ease of use with the DWIN DGUS V7.6 GUI Development environment, requiring no coding skills for creating user interfaces. It features a GUI with rich controls and an open OS kernel for customization. For more details, check the Getting Started Guide and follow the instructions.
Creating IoT Energy Meter UI for Display
Creating a visual and touch UI for the IoT AC Energy meter requires a lot of time and skills. Therefore I have created the UI, which you can just download into the memory of your display.
For UI creation, you may follow our previous projects using the DWIN HMI Display:
- Getting started with DWIN HMI TFT LCD Display
- Interfacing DWIN HMI TFT LCD Display with Arduino
- Smart Home Controller using DWIN HMI Display & ESP32
Using the above tutorial you can also learn how to use the display as well as the process to connect it to your computer and download the UI files to the memory.
For the Energy meter project, I created the UI using the same DGUS Software, which I used earlier.
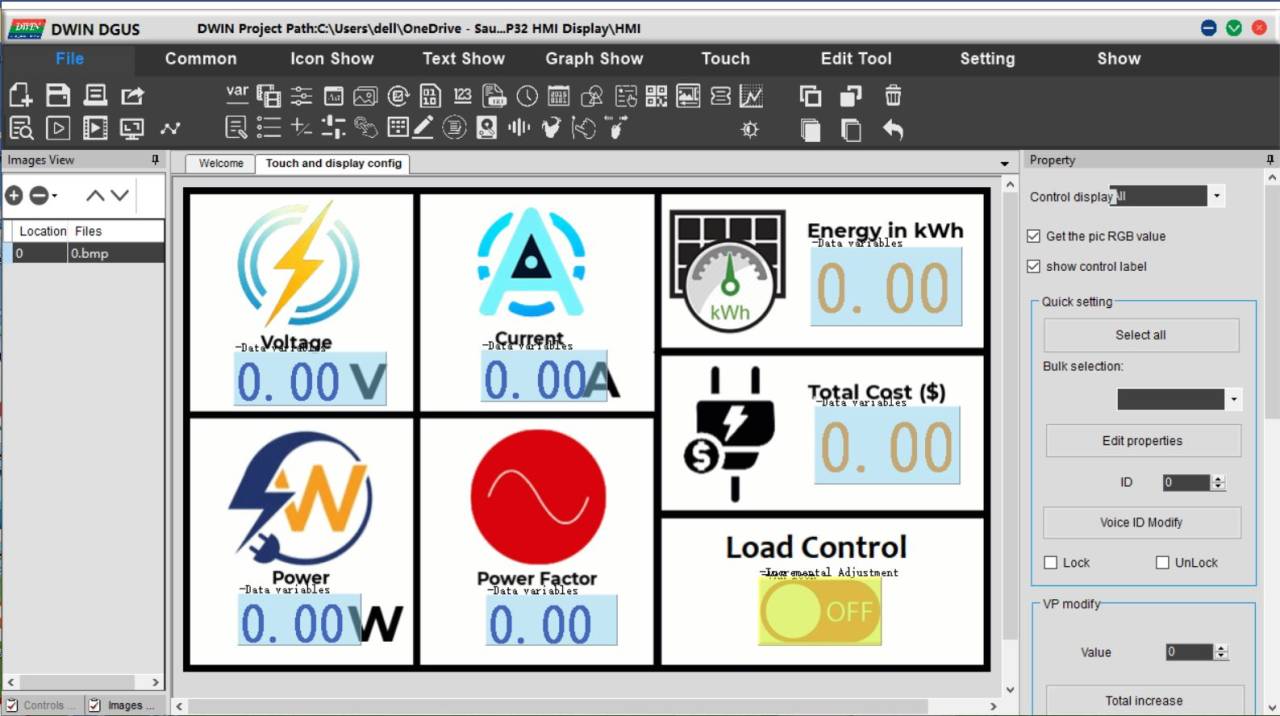
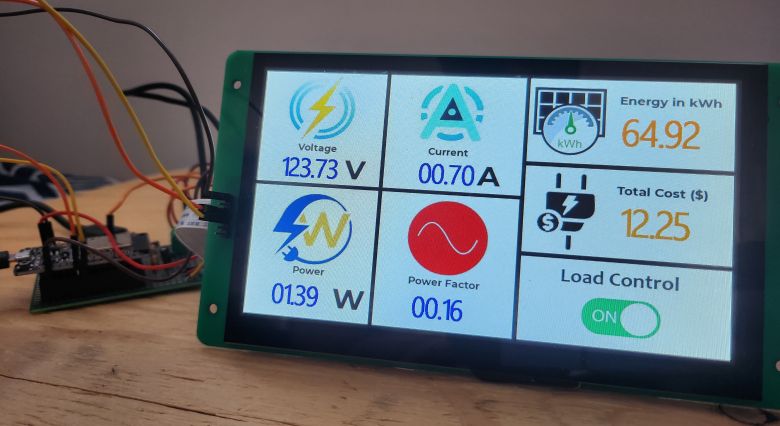
I created 6 numeric display boxes where the data of Voltage, Current, Power, Power Factor, Energy in kWh, and Total Cost can be displayed. A touch-based part is also assigned which can be clicked to turn on/off the Load.
Here are the project files that you need for this display.
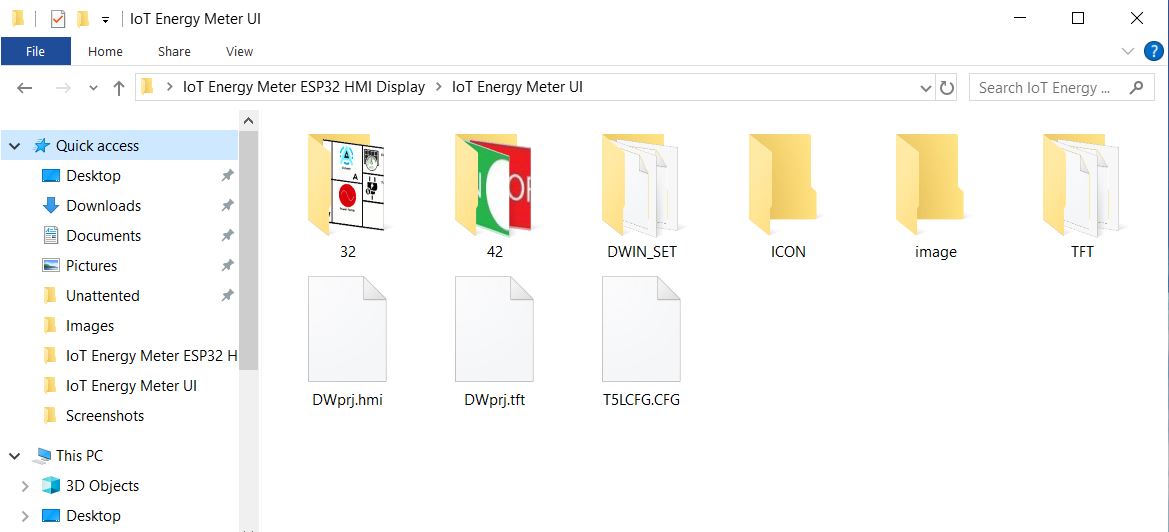
Everything is ready and compiled, you don’t need to create any UI. All you need is to download the DWIN_SET folder content to the Display memory. Follow the above previous tutorial to learn how to download the firmware.
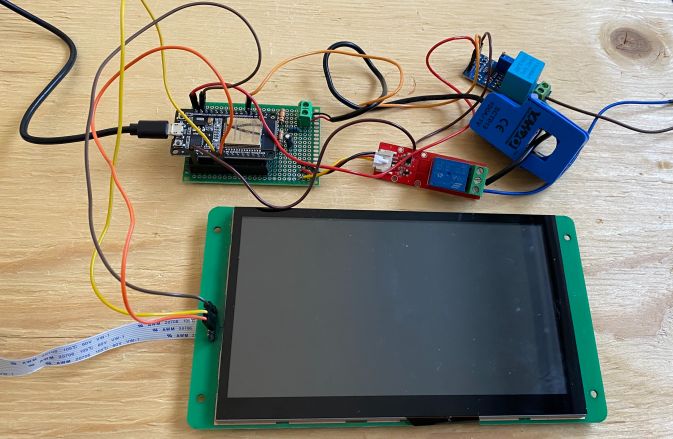
After the firmware is downloaded to the Display, the Display will look like this.
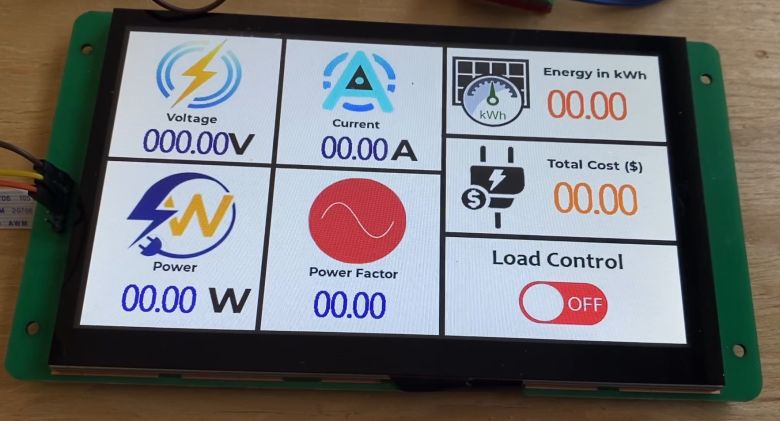
Hence your DWIN HMI LCD Display is now ready to work with Energy Meter.
Block Diagram of IoT AC Energy Meter
Let us take a look at the block diagram of the IoT AC Energy Meter. It is built around the ESP32 microcontroller, which is equipped with WiFi capabilities for internet connectivity. Here’s a breakdown of the hardware components and their functions:
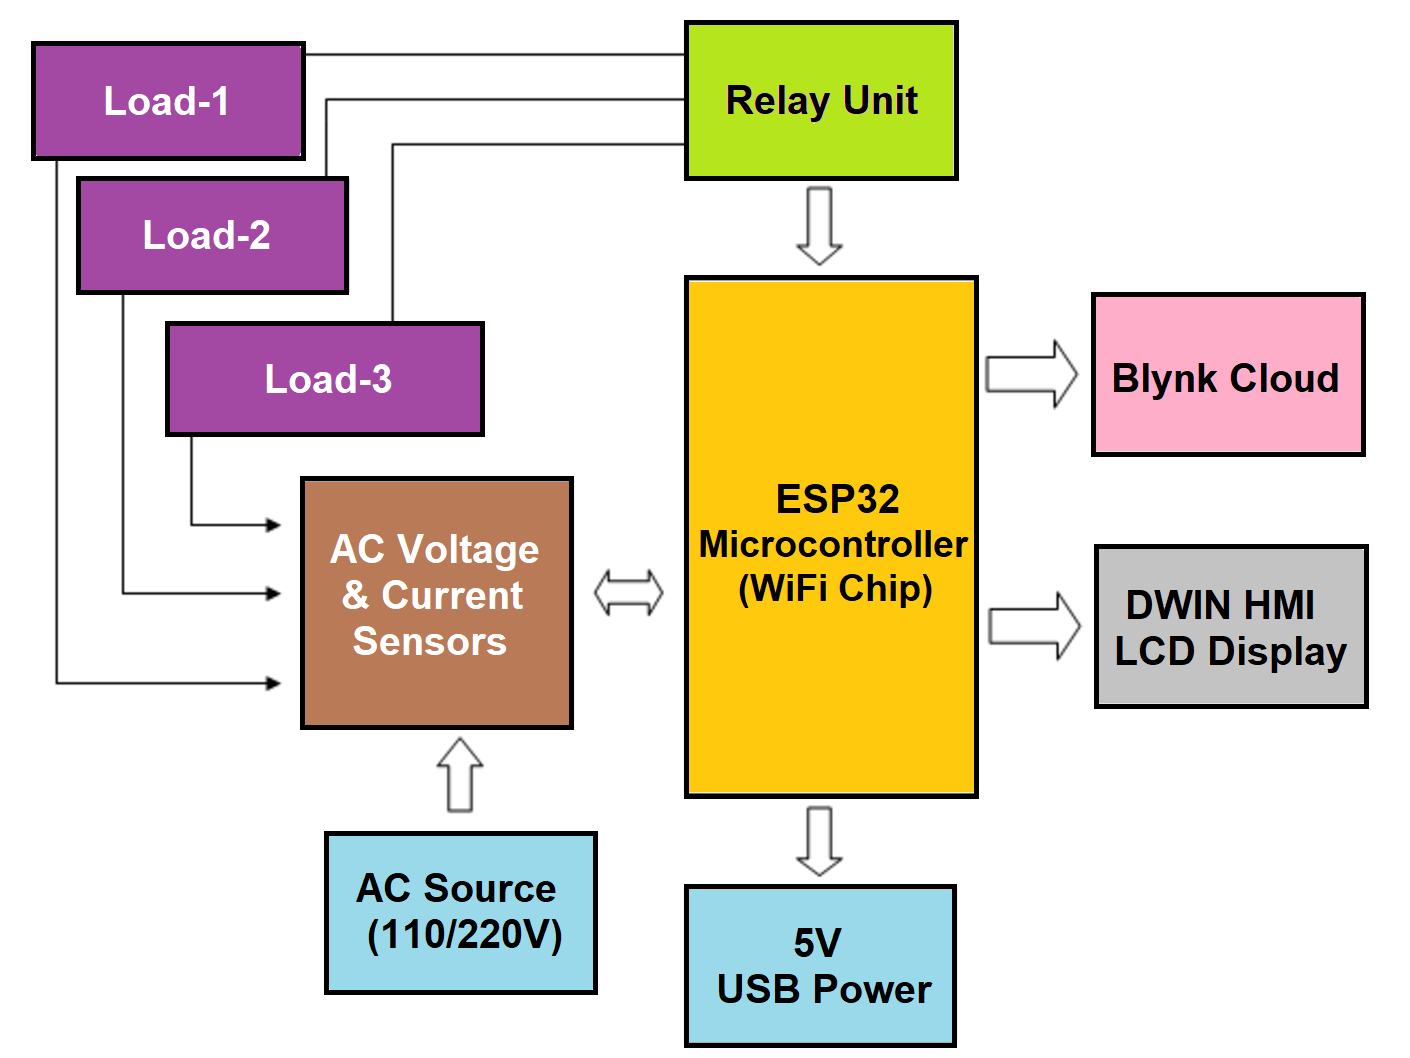
- ESP32 Microcontroller (WiFi Chip): This is the central processing unit of the energy meter, which handles data acquisition from sensors, processes it and communicates with external platforms like the Blynk Cloud for data visualization and control.
- DWIN HMI HMI Display: A 7-inch display from DWIN Technology is used for local visualization of electrical parameters such as RMS voltage, current, power, power factor, energy consumption, and cost of electricity.
- AC Voltage & Current Sensors: These sensors are crucial for the measurement of electrical parameters. The current sensor (likely SCT-013) and voltage sensor (ZMPT101B) detect the current and voltage of the connected loads to calculate power and energy consumption.
- Relay Unit: This unit acts as a switch to control the connected loads, which can be operated either via the HMI display or remotely through the Blynk app.
- Blynk Cloud: An online platform that receives data from the ESP32 microcontroller. It allows for remote monitoring and control of the energy meter, presenting data on a dashboard accessible via the Internet.
- Load-1, Load-2, Load-3: These are the electrical loads (such as lights, heaters, motors, etc.) whose energy consumption is being monitored and controlled by the system.
- 5V USB Power: This provides the necessary power to the ESP32 microcontroller, sourced from a standard USB power adapter.
- AC Source (110/220V): The primary source of alternating current that powers the loads and is also monitored by the voltage and current sensors for energy measurement.
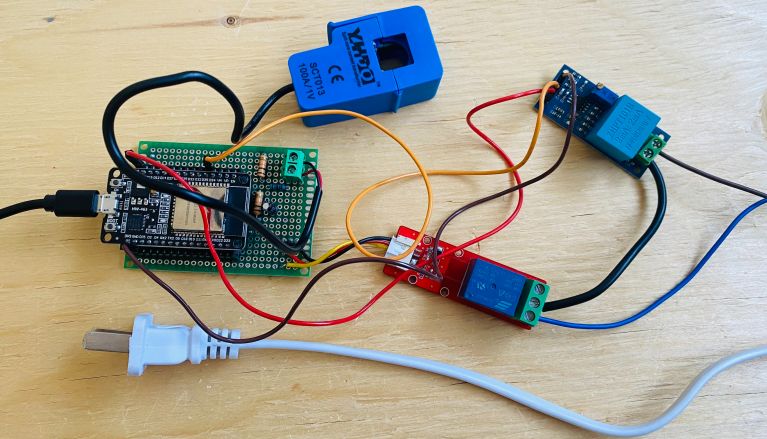
Circuit Diagram & Hardware Setup
The circuit diagram for the IoT AC Energy Meter using ESP32, SCT-013 Current Sensor, ZMPT101B Voltage Sensor & HMI Display is shown below.
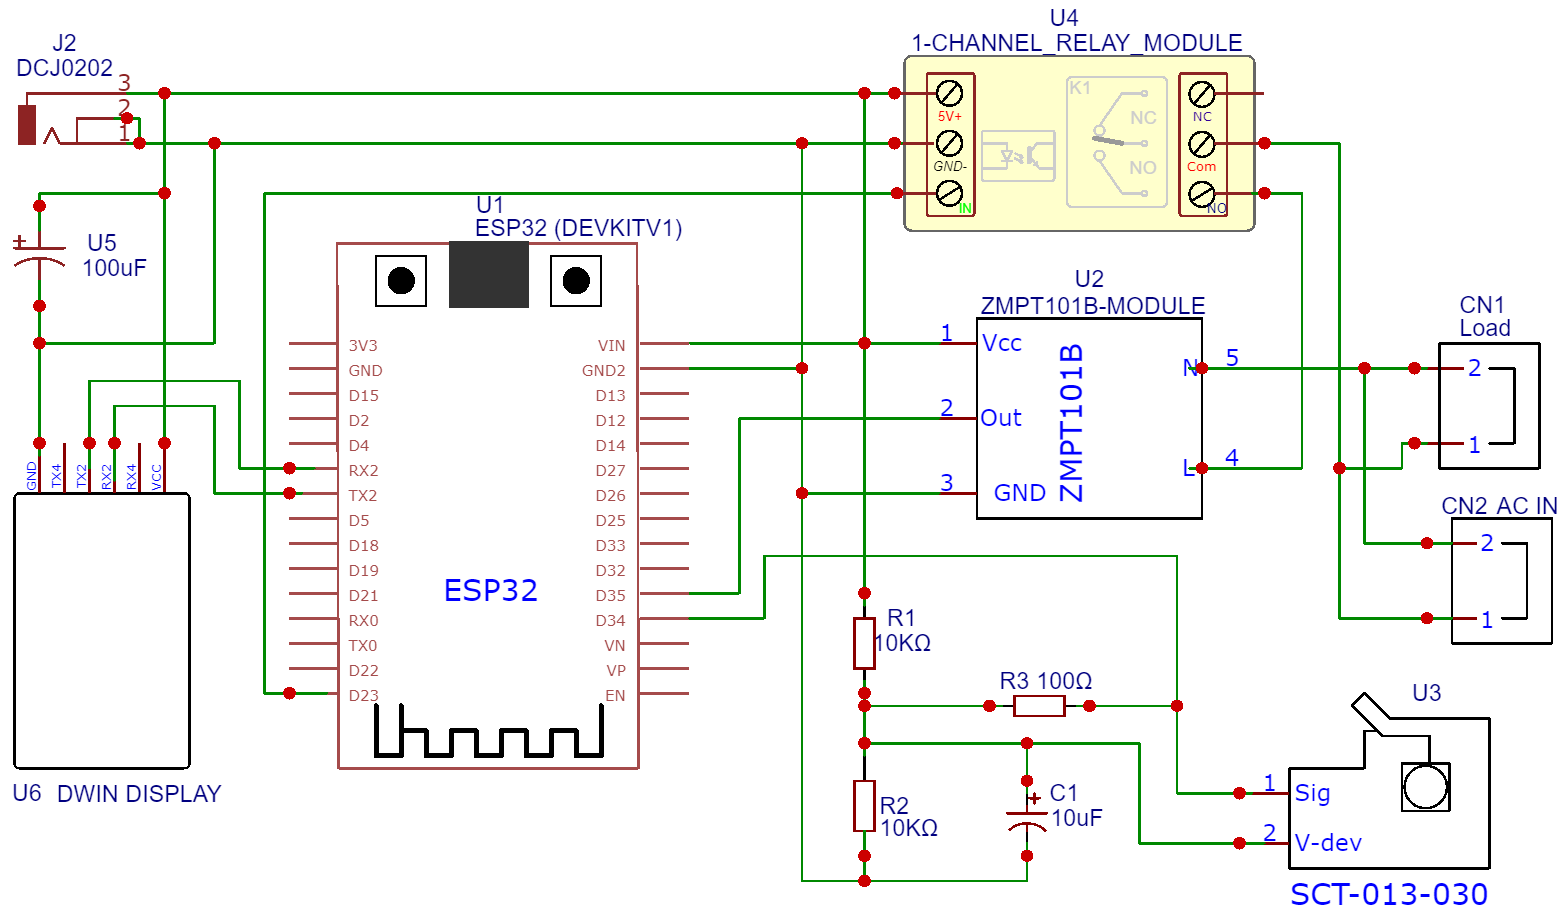
The VCC & GND pins of both the SCT-013 Current Sensor and ZMPT101B Voltage Sensor are connected to the Vin & GND of ESP32, which is a 5V supply. The output analog pin of the ZMPT101B Voltage Sensor is connected to the GPIO35 of ESP32 and the output analog pin of the SCT-013 Current Sensor is connected to the GPIO34 of ESP32. Additionally, two 10K resistors and a single 100-ohm resistor, along with a 10uF capacitor, are required to complete the circuit.
The 5V 1-Channel Relay can be controlled via GPIO23 of ESP32. The Relay is supplied with 5V power supply. To power the entire circuit and DWIN Display, use a 5V DC Adapter.
To measure the current and voltage, the AC wires must be connected to the input AC Terminal of the Voltage Sensor. For the Current Sensor, only a single live or neutral wire needs to be inserted inside the clip part. The load and AC Supply is controlled using the Relay.
Blynk Dashboard Setup
To monitor the IoT AC Energy Meter data from ESP32, we need to set the Blynk Dashboard. Blynk is an application that runs over Android and IOS devices to control any IoT-based application using Smartphones. It allows you to create your Graphical user interface for IoT applications. Here we will display the IoT Energy Meter Data on the Blynk Web Dashboard and also in the mobile Application.
Visit blynk.io and sign up using the email ID.
First Create a New Template.
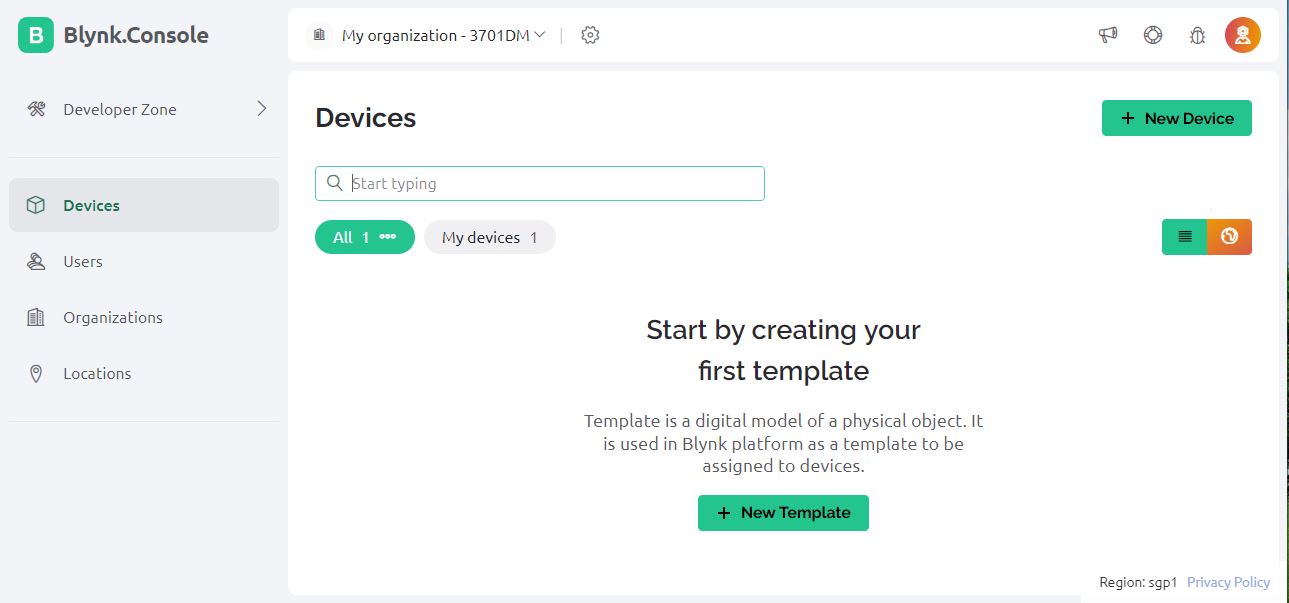
Give the Template any Name such as ‘IoT Energy Meter‘.
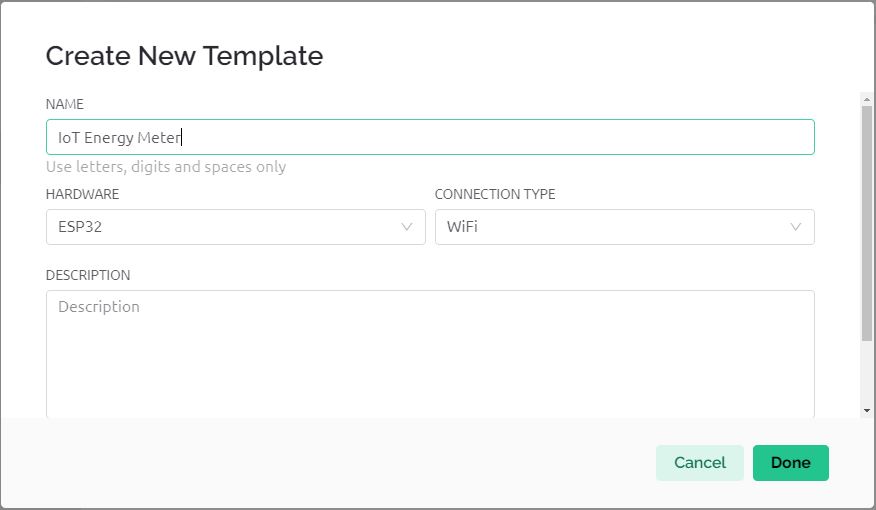
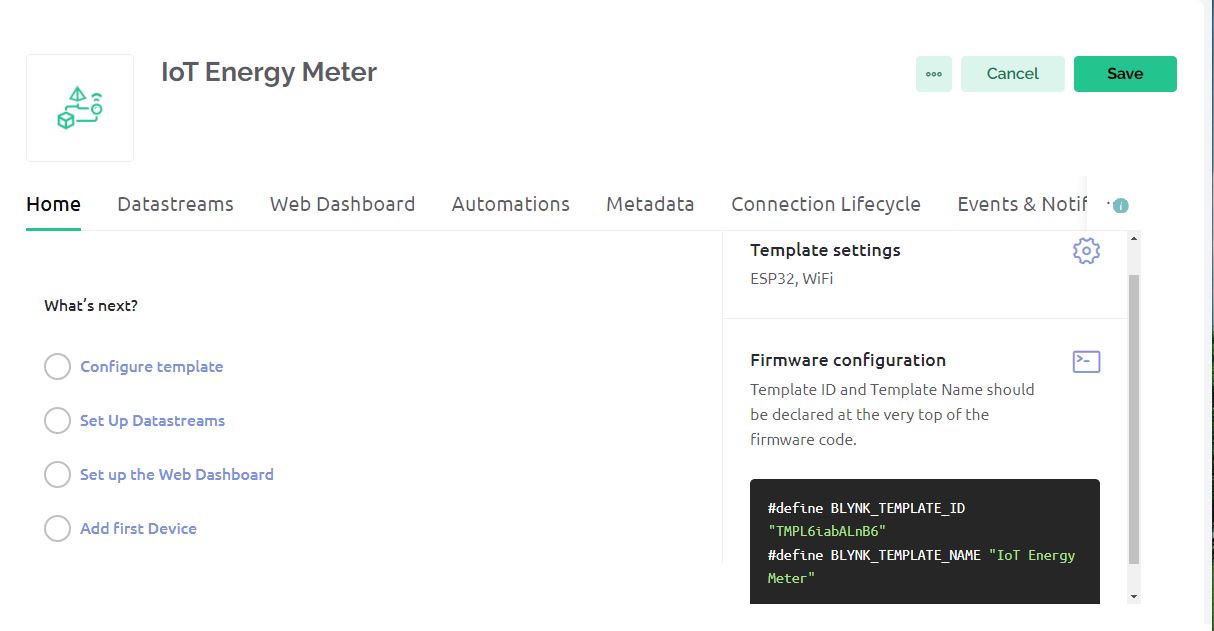
So a Template called IoT Energy Meter is created.
Now go the the Datstreams Section. Here we need to create 7 Datastreams.
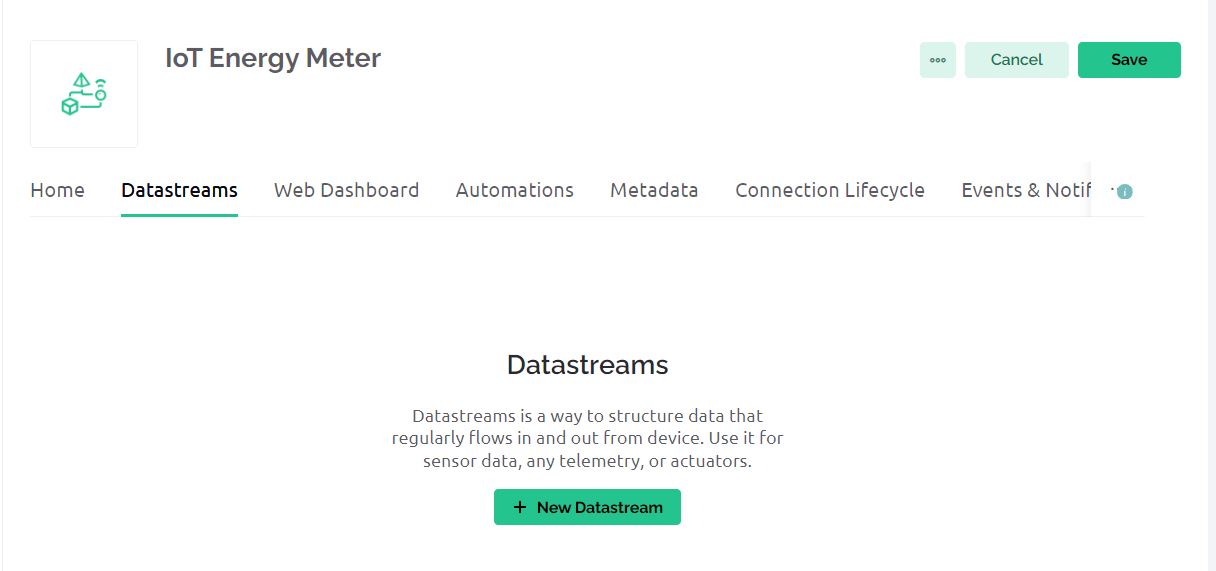
Click on New Datastream and assign the value of Voltage as shown in the image below.
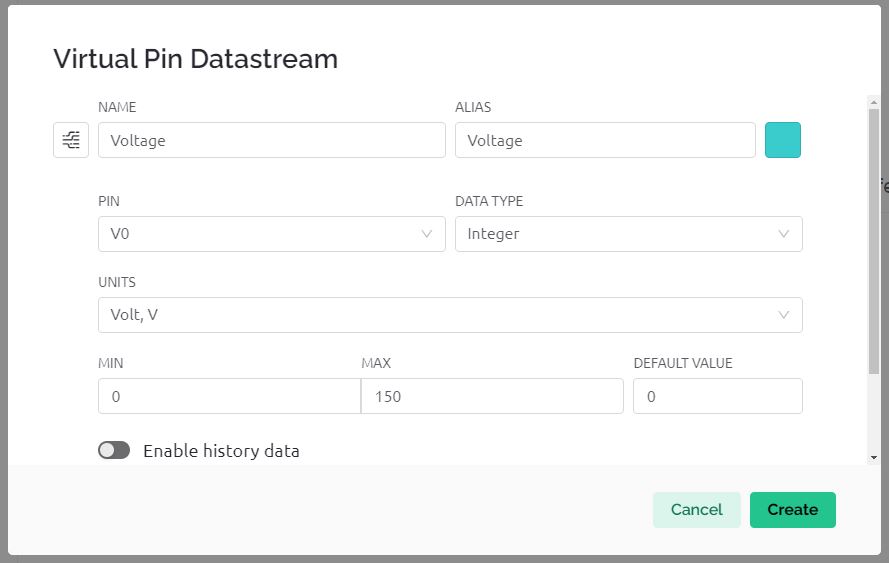
We need to create Virtual Pins for Voltage, Current, Power, Power Factor, Energy Consumption, Cost, and Load Control.
| Name | Pin | Data Type | Units |
|---|---|---|---|
| Voltage | V0 | Double | V |
| Current | V1 | Double | A |
| Power | V2 | Double | W |
| Power Factor | V3 | Double | – |
| Energy Consumption | V4 | Double | kWh |
| Cost | V5 | Double | – |
| Load Control | V6 | Integer | – |
The table shows that each parameter is measured with a different virtual pin (V0 to V6).
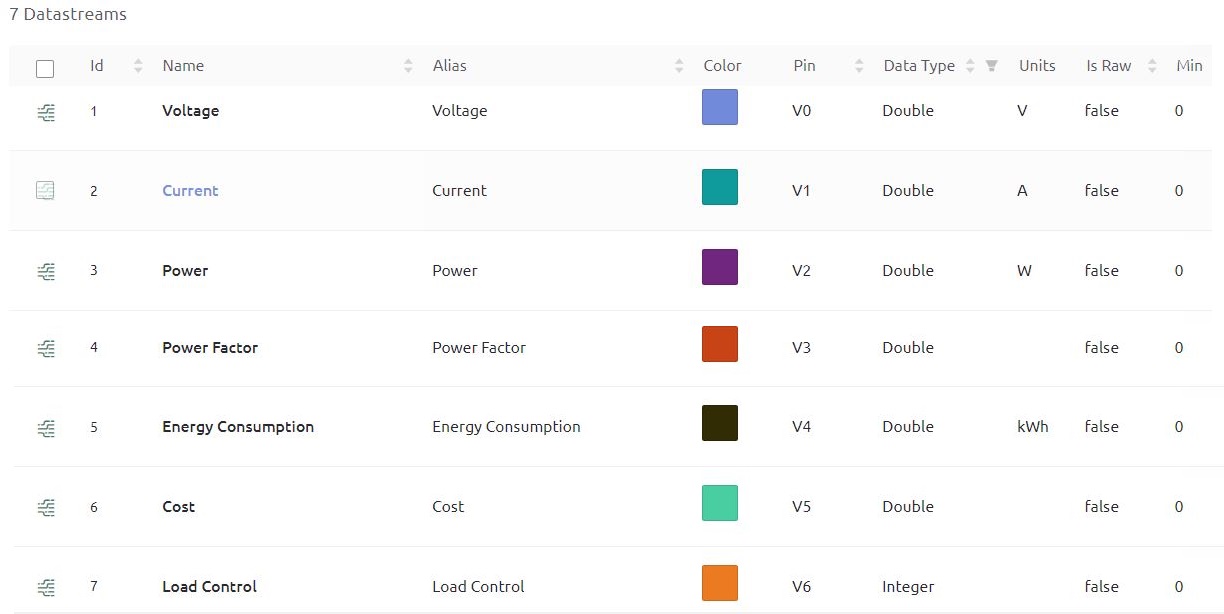
Once all the data streams are created, we need to set up the Web Dashboard.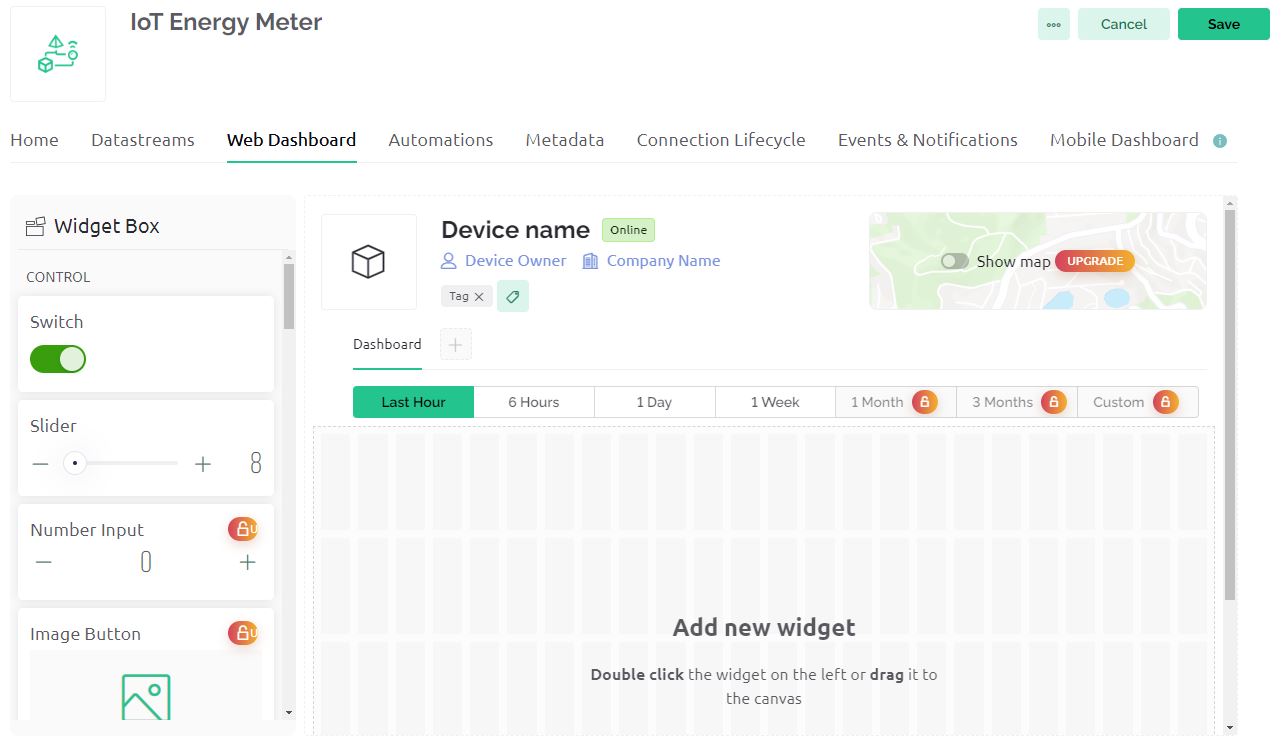
Select the Gauge widgets for all the values displayed. For the Load Control part select the Switch. Also, assign the virtual pins for all the widgets.
Finally, when the Dashboard is created, we need to create the Device.
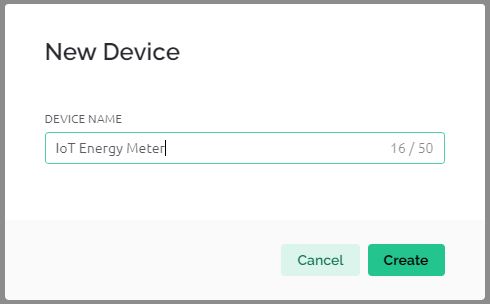
Give the device a name called ‘IoT Energy Meter‘ and click on Create. Finally, the device will be created and the dashboard is ready.
You need to copy the Authentication token and device credentials. They will be used in the code.
ZMPT101B Voltage Sensor Calibration
The ZMPT101B Voltage Sensor does not arrive pre-calibrated, so it necessitates an initial calibration process. An Arduino UNO/Nano Board serves as a suitable tool for this purpose due to its linear ADC pins. For calibration, the analog pin A0 on the Arduino can be utilized.
Now upload the following code to the Arduino Board.
|
1 2 3 4 5 6 7 8 9 10 |
void setup() { Serial.begin(9600); } void loop() { Serial.println(analogRead(A0)); delay(100); } |
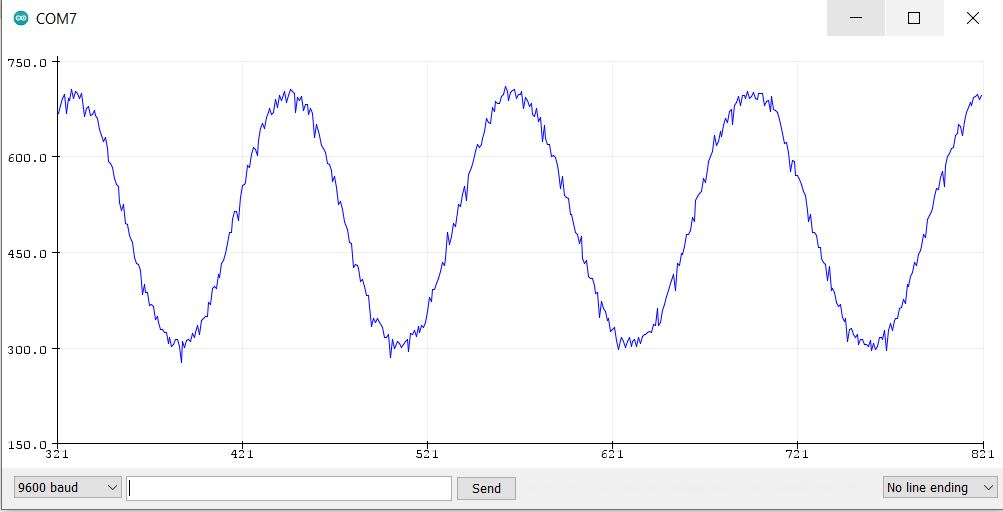
Once the code is uploaded, launch the Serial Plotter to observe the output. If a sine wave is not displayed on the Serial Plotter, adjust the potentiometer until the sensor outputs a correct sine wave. A proper sine wave indicates that the sensor has been calibrated accurately.
Source Code/Program
Lets take a look at the source code/program for IoT Based AC Energy Meter written for ESP32. The code is designed to monitor and control an IoT-based AC energy meter. It measures voltage, current, power, power factor, energy consumption (kWh), and cost estimation using an ESP32 microcontroller with Blynk for remote monitoring. The power can be calculated using the AC Wattage Calculator.
It features EEPROM data storage, relay control for power management, and a DWIN display for local user interface. The Blynk platform allows users to view real-time data and control the system remotely through a mobile app. The 7-inch DWIN LCD Display also shows the visualized value of energy meter parameters.
Please modify the specified lines in the code with your own Wi-Fi SSID, password, and Blynk authentication token.
|
1 2 3 4 |
// Blynk and WiFi credentials const char auth[] = "*******************"; const char ssid[] = "*******************"; const char pass[] = "*******************"; |
After updating the necessary lines with your credentials, you can proceed to upload the code to your ESP32 board. To do this, select the ‘ESP32 Dev Module’ from the board options and choose the correct COM port to which your ESP32 is connected. Once you have selected these options, click the ‘Upload‘ button to begin the code upload process.
|
1 2 3 4 5 6 7 8 9 10 11 12 13 14 15 16 17 18 19 20 21 22 23 24 25 26 27 28 29 30 31 32 33 34 35 36 37 38 39 40 41 42 43 44 45 46 47 48 49 50 51 52 53 54 55 56 57 58 59 60 61 62 63 64 65 66 67 68 69 70 71 72 73 74 75 76 77 78 79 80 81 82 83 84 85 86 87 88 89 90 91 92 93 94 95 96 97 98 99 100 101 102 103 104 105 106 107 108 109 110 111 112 113 114 115 116 117 118 119 120 121 122 123 124 125 126 127 128 129 130 131 132 133 134 135 136 137 138 139 140 141 142 143 144 145 146 147 148 149 150 151 152 153 154 155 156 157 158 159 160 161 162 163 164 165 166 167 168 169 170 171 172 173 174 175 176 177 178 179 180 181 182 183 184 185 186 187 188 189 190 191 192 193 194 195 196 197 198 199 200 201 |
#define BLYNK_TEMPLATE_ID "****************" #define BLYNK_TEMPLATE_NAME "IoT Energy Meter" #define BLYNK_PRINT Serial #include "EmonLib.h" #include <EEPROM.h> #include <WiFi.h> #include <WiFiClient.h> #include <BlynkSimpleEsp32.h> const byte rxPin = 16; //rx2 const byte txPin = 17; //tx2 HardwareSerial dwin(1); // Constants for calibration const float vCalibration = 45.5; const float currCalibration = 0.15; // Cost per kWh (you can adjust this) const float costPerKWh = 10; // Assuming 10 USD per kWh // Blynk and WiFi credentials const char auth[] = "****************"; const char ssid[] = "****************"; const char pass[] = "****************"; // Define the relay pin const int relayPin = 23; // EnergyMonitor instance EnergyMonitor emon; // Timer for regular updates BlynkTimer timer; // Variables for energy calculation and cost estimation float kWh = 0.0; float estimatedCost = 0.0; unsigned long lastMillis = millis(); // EEPROM address for kWh variable const int addrKWh = 0; /* Adresses of all sensors */ unsigned char Buffer[9]; #define voltage_add 0x31 #define current_add 0x32 #define power_add 0x33 #define powerfactor_add 0x34 #define kwh_add 0x35 #define cost_add 0x36 unsigned char HMI_voltage[8] = {0x5a, 0xa5, 0x05, 0x82, voltage_add , 0x00, 0x00, 0x00}; unsigned char HMI_current[8] = {0x5a, 0xa5, 0x05, 0x82, current_add, 0x00, 0x00, 0x00}; unsigned char HMI_power[8] = {0x5a, 0xa5, 0x05, 0x82, power_add , 0x00, 0x00, 0x00}; unsigned char HMI_powerfactor[8] = {0x5a, 0xa5, 0x05, 0x82, powerfactor_add, 0x00, 0x00, 0x00}; unsigned char HMI_kwh[8] = {0x5a, 0xa5, 0x05, 0x82, kwh_add , 0x00, 0x00, 0x00}; unsigned char HMI_cost[8] = {0x5a, 0xa5, 0x05, 0x82, cost_add, 0x00, 0x00, 0x00}; // Function prototypes void sendEnergyDataToBlynk(); void readKWhFromEEPROM(); void saveKWhToEEPROM(); void setup() { Serial.begin(115200); Blynk.begin(auth, ssid, pass); //Begin serial communication DWIN dwin.begin(115200, SERIAL_8N1, rxPin, txPin); // Initialize the relay pin pinMode(relayPin, OUTPUT); digitalWrite(relayPin, LOW); // Set relay to off initially EEPROM.begin(sizeof(kWh)); // Allocate enough bytes for the kWh float value readKWhFromEEPROM(); emon.voltage(35, vCalibration, 1.7); // Voltage: input pin, calibration, phase_shift emon.current(34, currCalibration); // Current: input pin, calibration // Pre-calibration cycle for (int i = 0; i < 10; i++) { // Run calcVI 10 times to stabilize emon.calcVI(20, 2000); delay(500); } timer.setInterval(5000L, sendEnergyDataToBlynk); } void loop() { Blynk.run(); timer.run(); realy_control(); // Check and execute relay commands from HMI } // Continue from your existing variables and setup... void realy_control() { if (dwin.available()) { for (int i = 0; i <= 8; i++) { // Store the whole frame in the buffer array. Buffer[i] = dwin.read(); } if (Buffer[0] == 0X5A) { // Example command addresses might need to be adjusted switch (Buffer[4]) { case 0x37: // Example address for relay control if (Buffer[8] == 1) { digitalWrite(relayPin, HIGH); Serial.println("Relay ON"); } else { digitalWrite(relayPin, LOW); Serial.println("Relay OFF"); } break; // Add cases for other relays or controls if needed default: //Serial.println("No valid relay control data."); break; } } } } // Blynk function to control the relay BLYNK_WRITE(V6) { // Assuming you use Virtual Pin V6 for the relay control int relayState = param.asInt(); digitalWrite(relayPin, relayState); // Control the relay } void sendEnergyDataToBlynk() { emon.calcVI(20, 2000); // Calculate all. No.of half wavelengths (crossings), time-out // Calculate energy consumed in kWh unsigned long currentMillis = millis(); kWh += emon.realPower * (currentMillis - lastMillis) / 3600000000.0; estimatedCost = kWh * costPerKWh; lastMillis = currentMillis; Serial.printf("Vrms: %.2fV\tIrms: %.4fA\tPower: %.4fW\tPower Factor: %.2f\tkWh: %.5fkWh\tEstimated Cost: $%.2f\n", emon.Vrms, emon.Irms, emon.realPower, emon.powerFactor, kWh, estimatedCost); saveKWhToEEPROM(); // Convert float to int for HMI int Vrms_int = static_cast<int>(emon.Vrms * 100); // Example: Vrms multiplied by 100 int Irms_int = static_cast<int>(emon.Irms * 1000); // Example: Irms multiplied by 1000 int realPower_int = static_cast<int>(emon.realPower * 100); // Scale by 100 to preserve two decimal places int powerFactor_int = static_cast<int>(emon.powerFactor * 100); // Example: Power Factor multiplied by 100 int kWh_int = static_cast<int>(kWh * 10); // Example: kWh multiplied by 10 int estimatedCost_int = static_cast<int>(estimatedCost * 100); // Estimated Cost multiplied by 100 HMI_voltage[6] = highByte(Vrms_int); HMI_voltage[7] = lowByte(Vrms_int); dwin.write(HMI_voltage, 8); HMI_current[6] = highByte(Irms_int); HMI_current[7] = lowByte(Irms_int); dwin.write(HMI_current, 8); HMI_power[6] = highByte(realPower_int); HMI_power[7] = lowByte(realPower_int); dwin.write(HMI_power, 8); HMI_powerfactor[6] = highByte(powerFactor_int); HMI_powerfactor[7] = lowByte(powerFactor_int); dwin.write(HMI_powerfactor, 8); HMI_kwh[6] = highByte(kWh_int); HMI_kwh[7] = lowByte(kWh_int); dwin.write(HMI_kwh, 8); HMI_cost[6] = highByte(estimatedCost_int); HMI_cost[7] = lowByte(estimatedCost_int); dwin.write(HMI_cost, 8); // Update Blynk Blynk.virtualWrite(V0, emon.Vrms); Blynk.virtualWrite(V1, emon.Irms); Blynk.virtualWrite(V2, emon.realPower); Blynk.virtualWrite(V3, emon.powerFactor); Blynk.virtualWrite(V4, kWh); Blynk.virtualWrite(V5, estimatedCost); } void readKWhFromEEPROM() { EEPROM.get(addrKWh, kWh); if (isnan(kWh)) { kWh = 0.0; saveKWhToEEPROM(); } } void saveKWhToEEPROM() { EEPROM.put(addrKWh, kWh); EEPROM.commit(); } |
Testing IoT AC Energy Meter
The device is ready for testing once, the code uploading is done. The ESP32 reads the data from sensors and will take some time for initialization and calibration. It will connect to the WiFi network and will start displaying the value.
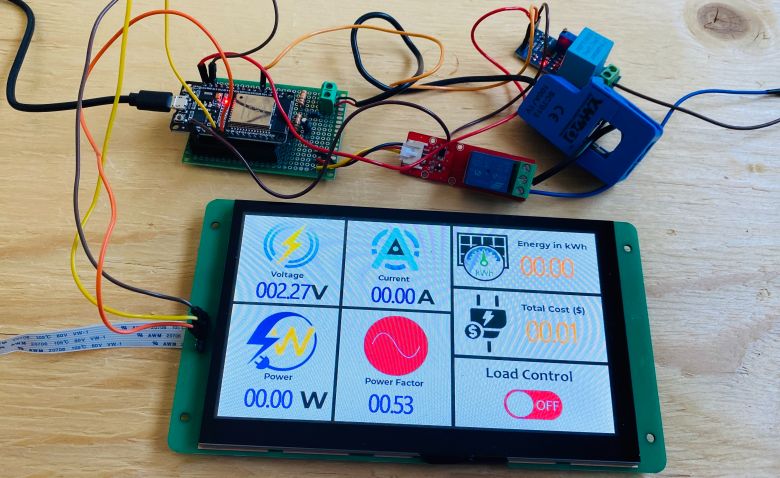
The DWIN Display will automatically start displaying some values of voltage, current, power, power factor, kWh & Cost. The value shown in the display is without any load and without any AC supply.
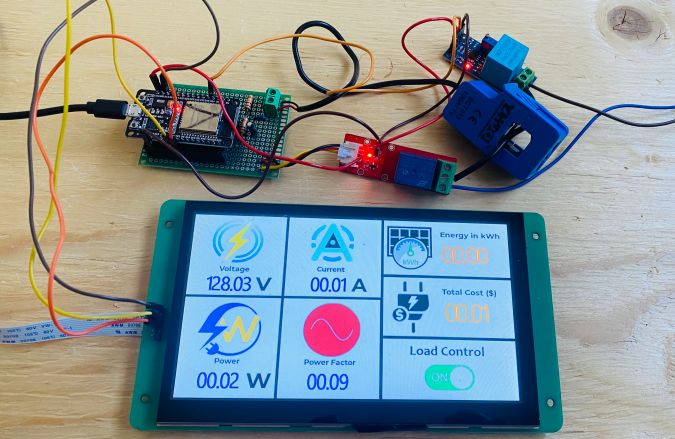
The Electric Load can be turned on from the DWIN Display load control section. Once the load and supply is powered on, the display will start display the real energy meter parameters.
If the load is turned on continuously for long hours, you will see rise in kWh and cost value.
Even if the device is powered off, the EEPROM stores the value of power and cost. So the value of kWh and Cost is added to the previous value.
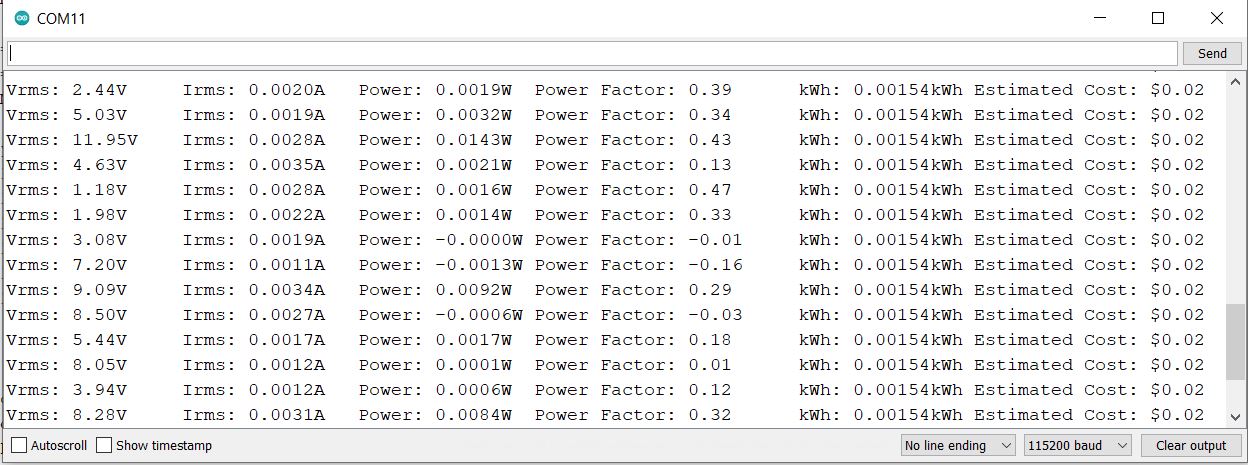
The same thing can be observed on the Serial Monitor. When no load and no supply is provided, the Serial Monitor displays the lowest.
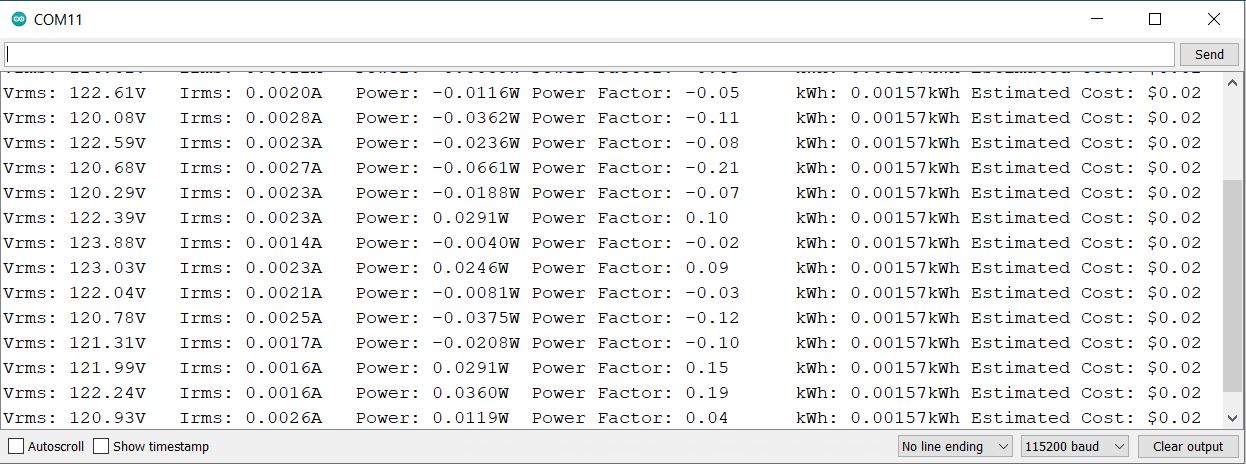
When the device is powered with AC supply and with load, the Serial Monitor shows the following value.
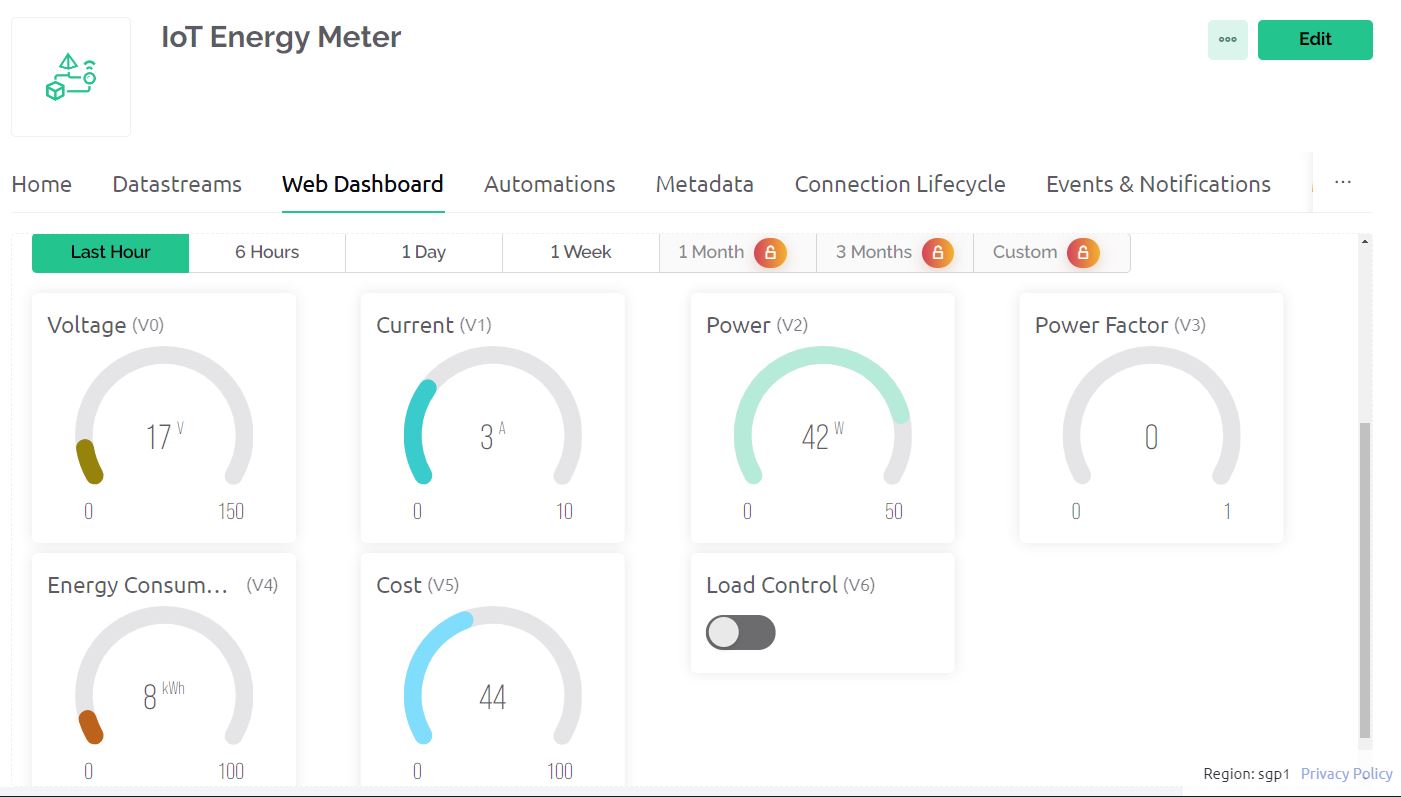
To monitor the IoT AC Energy Meter data remotely, we need to observe the data on Blynk Dashboard. So, go to the Blynk Dashboard and you will see the live data.
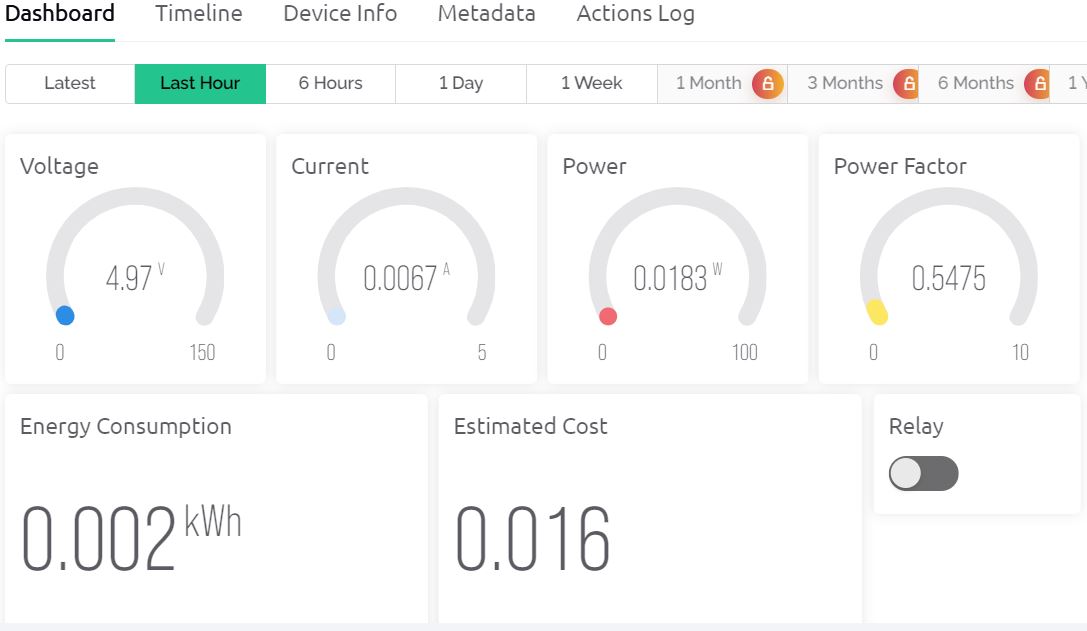
The Load can be turned on/off from the Blynk Dashboard as well.
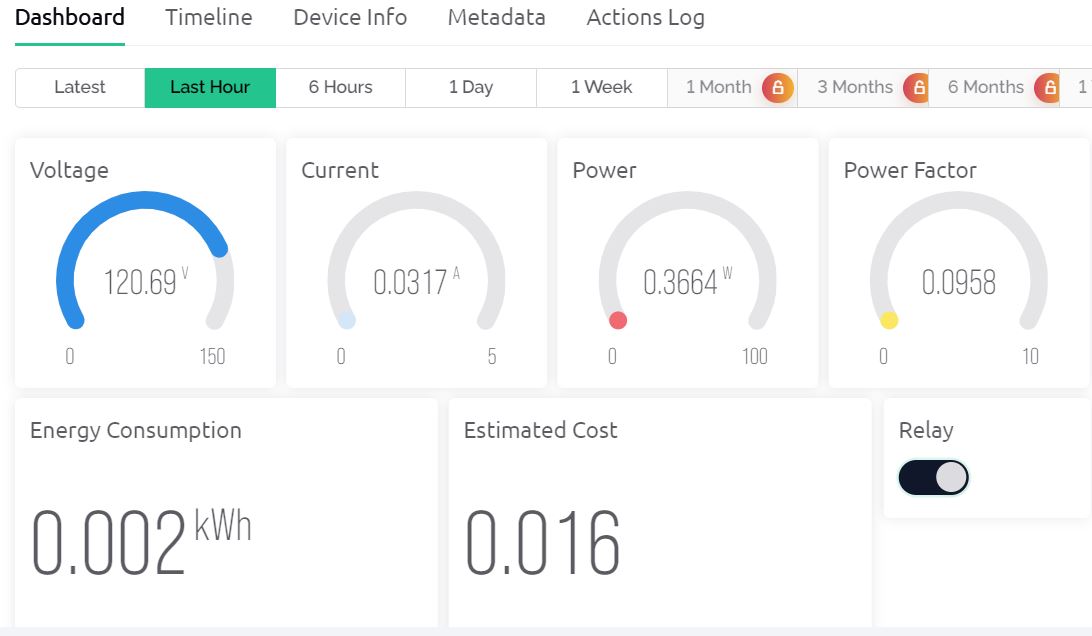
The Blynk allows the Energy meter data to be monitored wirelessly from any part of the world. Thus, we can design the IoT AC Energy Meter with ESP32, Current/Voltage Sensors easily and visualize the data on DWIN Display and Blynk Server.
Incase, you want more accurate results then you can use PZEM-004T AC Energy Meter module which can be interfaced with Arduino and ESP32 Microcontroller.


3 Comments
I think it would be much better if you do this from the meter’s RS485 input. Thus, there will be no need to purchase a current sensor.
HMI display please… not HDMI
Pesimo sistema, estas enviando las señales analogicas de unos sensores de 5v a unas entradas que solo soportan 3.3v