

ECG Monitoring with AD8232 ECG Sensor & Arduino
Heart diseases are becoming a big issue for the last few decades and many people die because of certain health problems. Therefore, heart disease cannot be taken lightly. By analyzing or monitoring the ECG signal at the initial stage this disease can be prevented. So we present this project, i.e ECG Monitoring with AD8232 ECG Sensor & Arduino with ECG Graph.
The AD8232 is a neat little chip used to measure the electrical activity of the heart. This electrical activity can be charted as an ECG or Electrocardiogram. Electrocardiography is used to help diagnose various heart conditions.
So in this project, we will interface AD8232 ECG Sensor with Arduino and observe the ECG signal on a serial plotter or Processing IDE.
You can check the advanced version of this project here: IoT Based ECG Monitoring with AD8232 ECG Sensor & ESP32
Bill of Materials
| S.N. | Components Name | Quantity | |
|---|---|---|---|
| 1 | Arduino UNO Board | 1 | Amazon | AliExpress |
| 2 | AD8232 ECG Sensor | 1 | Amazon | AliExpress |
| 3 | Connecting Wires | 10 | Amazon | AliExpress |
| 4 | Breadboard | 1 | Amazon | AliExpress |
What is ECG?

An ECG is a paper or digital recording of the electrical signals in the heart. It is also called an electrocardiogram or an EKG. The ECG is used to determine heart rate, heart rhythm, and other information regarding the heart’s condition. ECGs are used to help diagnose heart arrhythmias, heart attacks, pacemaker function, and heart failure.

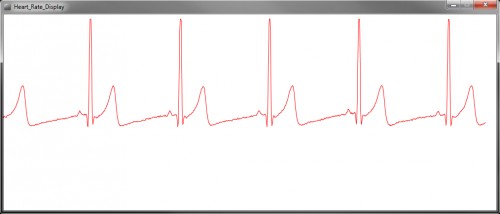
ECG can be analyzed by studying components of the waveform. These waveform components indicate cardiac electrical activity. The first upward of the ECG tracing is the P wave. It indicates atrial contraction.
The QRS complex begins with Q, a small downward deflection, followed by a larger upwards deflection, a peak (R); and then a downwards S wave. This QRS complex indicates ventricular depolarization and contraction.
Finally, the T wave, which is normally a smaller upwards waveform, representing ventricular re-polarization.
Medical uses of ECG
An electrocardiogram can be a useful way to find out whether your high blood pressure has caused any damage to your heart or blood vessels. Because of this, you may be asked to have an ECG when you are first diagnosed with high blood pressure.
Some of the things an ECG reading can detect are:
|
1 2 3 4 |
1. cholesterol clogging up your heart’s blood supply 2. a heart attack in the past 3. enlargement of one side of the heart 4. abnormal heart rhythms |
AD8232 ECG Sensor
This sensor is a cost-effective board used to measure the electrical activity of the heart. This electrical activity can be charted as an ECG or Electrocardiogram and output as an analog reading. ECGs can be extremely noisy, the AD8232 Single Lead Heart Rate Monitor acts as an op-amp to help obtain a clear signal from the PR and QT Intervals easily.

The AD8232 is an integrated signal conditioning block for ECG and other biopotential measurement applications. It is designed to extract, amplify, and filter small biopotential signals in the presence of noisy conditions, such as those created by motion or remote electrode placement.
The AD8232 module breaks out nine connections from the IC that you can solder pins, wires, or other connectors to. SDN, LO+, LO-, OUTPUT, 3.3V, GND provide essential pins for operating this monitor with an Arduino or other development board. Also provided on this board are RA (Right Arm), LA (Left Arm), and RL (Right Leg) pins to attach and use your own custom sensors. Additionally, there is an LED indicator light that will pulsate to the rhythm of a heartbeat.
Note: This product is NOT a medical device and is not intended to be used as such or as an accessory to such nor diagnose or treat any conditions.
Circuit Diagram/Connection between Arduino and ECG Sensor AD8232
The AD8232 Heart Rate Monitor breaks out nine connections from the IC. We traditionally call these connections “pins” because they come from the pins on the IC, but they are actually holes that you can solder wires or header pins to.

We’ll connect five of the nine pins on the board to Arduino. The five pins you need are labeled GND, 3.3v, OUTPUT, LO-, and LO+.

AD8232 ECG Sensor Placement on Body
It is recommended to snap the sensor pads on the leads before application to the body. The closer to the heart the pads are, the better the measurement. The cables are color-coded to help identify proper placement.

Red: RA (Right Arm)
Yellow: LA (Left Arm)
Green: RL (Right Leg)
Arduino Source Code/Program
|
1 2 3 4 5 6 7 8 9 10 11 12 13 14 15 16 17 18 19 20 |
void setup() { // initialize the serial communication: Serial.begin(9600); pinMode(10, INPUT); // Setup for leads off detection LO + pinMode(11, INPUT); // Setup for leads off detection LO - } void loop() { if((digitalRead(10) == 1)||(digitalRead(11) == 1)){ Serial.println('!'); } else{ // send the value of analog input 0: Serial.println(analogRead(A0)); } //Wait for a bit to keep serial data from saturating delay(1); } |
Processing IDE Source Code/Program
Once the code is uploaded, you can see the value on serial monitor and also on the serial plotter.
But if you want a separate graph and want to plot it on Processing IDE, you can use the code below and play.
|
1 2 3 4 5 6 7 8 9 10 11 12 13 14 15 16 17 18 19 20 21 22 23 24 25 26 27 28 29 30 31 32 33 34 35 36 37 38 39 40 41 42 43 44 45 46 47 48 49 50 51 52 53 54 55 56 57 58 59 60 61 62 63 64 65 66 67 68 69 70 71 72 73 74 75 76 77 78 79 80 81 82 83 84 85 86 87 88 89 90 91 92 93 94 95 96 97 98 99 100 101 102 103 104 105 106 107 108 109 |
import processing.serial.*; Serial myPort; // The serial port int xPos = 1; // horizontal position of the graph float height_old = 0; float height_new = 0; float inByte = 0; int BPM = 0; int beat_old = 0; float[] beats = new float[500]; // Used to calculate average BPM int beatIndex; float threshold = 620.0; //Threshold at which BPM calculation occurs boolean belowThreshold = true; PFont font; void setup () { // set the window size: size(1000, 400); // List all the available serial ports println(Serial.list()); // Open whatever port is the one you're using. myPort = new Serial(this, Serial.list()[2], 9600); // don't generate a serialEvent() unless you get a newline character: myPort.bufferUntil('\n'); // set inital background: background(0xff); font = createFont("Ariel", 12, true); } void draw () { //Map and draw the line for new data point inByte = map(inByte, 0, 1023, 0, height); height_new = height - inByte; line(xPos - 1, height_old, xPos, height_new); height_old = height_new; // at the edge of the screen, go back to the beginning: if (xPos >= width) { xPos = 0; background(0xff); } else { // increment the horizontal position: xPos++; } // draw text for BPM periodically if (millis() % 128 == 0){ fill(0xFF); rect(0, 0, 200, 20); fill(0x00); text("BPM: " + inByte, 15, 10); } } void serialEvent (Serial myPort) { // get the ASCII string: String inString = myPort.readStringUntil('\n'); if (inString != null) { // trim off any whitespace: inString = trim(inString); // If leads off detection is true notify with blue line if (inString.equals("!")) { stroke(0, 0, 0xff); //Set stroke to blue ( R, G, B) inByte = 512; // middle of the ADC range (Flat Line) } // If the data is good let it through else { stroke(0xff, 0, 0); //Set stroke to red ( R, G, B) inByte = float(inString); // BPM calculation check if (inByte > threshold && belowThreshold == true) { calculateBPM(); belowThreshold = false; } else if(inByte < threshold) { belowThreshold = true; } } } } void calculateBPM () { int beat_new = millis(); // get the current millisecond int diff = beat_new - beat_old; // find the time between the last two beats float currentBPM = 60000 / diff; // convert to beats per minute beats[beatIndex] = currentBPM; // store to array to convert the average float total = 0.0; for (int i = 0; i < 500; i++){ total += beats[i]; } BPM = int(total / 500); beat_old = beat_new; beatIndex = (beatIndex + 1) % 500; // cycle through the array instead of using FIFO queue } |
If the processing sketch does not work, you may need to modify the following line:
|
1 |
myPort = new Serial(this, Serial.list()[2], 9600); |
Here 2 is the port number, replace it with 1,3,4,5, or whatever your Arduino Port is.
Video Tutorial & Explanation

You can check the advanced version of this project here: IoT Based ECG Monitoring. If you want to learn about Electromyography, you can follow the Myoware EMG Sensor Guide.

")


13 Comments
How can i show the graph in Android code.?… can You please give me the code for Iot based of this project… ? Thanks in Advance..
i am using ubuntu how modify prot number in above program
I want to interface the heart rate ecg module to Arduino nano I tried to interface the connection but the plot in serial monitoring was displays only one minute otherwise it was not working , please give solution to draw the plot in continuous plotting for ecg module thank you.
I want to interface the heart rate ecg module to Arduino nano I tried to interface the connection but the plot in serial monitoring was displays only one minute otherwise it was not working , please give solution to draw the plot in continuous plotting for ecg module thank you.
import processing.Serial.*;
this line is showing error as “import does not name a type”
Is it possible to interface this board with BeagleBone Black
It is possible to integrate the sensor with any MCU whose analog ports can be accessed.
How can i plot on python tkinter GUI ?
Where will be the output shown?
this is a single-lead ECG. how can I have a 12-lead ECG using AD8232?
and thank you in advance .
HI
why the output is a square wave?
I would like to thank you, I will be using your work as the basis for an academic presentation. If everyone were like you, the world would be better than it is today. Thank you very much.
https://how2electronics.com/ecg-monitoring-with-ad8232-ecg-sensor-arduino/#comments
just can’t get the curve you have.