

Overview
In this project, we will design an Arduino-based Earthquake Detector Alarm equipped with a Seismic Graph, also known as a DIY Seismometer. The system utilizes the ADXL335 3-axis accelerometer as a sensor to detect tilting, trembling, or any shaking movements caused by an earthquake. The ADXL335 is interfaced with an Arduino and an LCD display to create the Earthquake Detector Alarm with a Seismic Graph.
The Arduino code, written in C++, retrieves acceleration values from the ADXL335 accelerometer and displays them on the LCD screen. For graphical visualization, we will develop a Python script. Using the Python matplotlib library, the script generates a graph representing the tilt or shaking state. Additionally, a buzzer or LED serves as an alarm, activating whenever the shaking exceeds a predefined threshold.
Bill of Materials
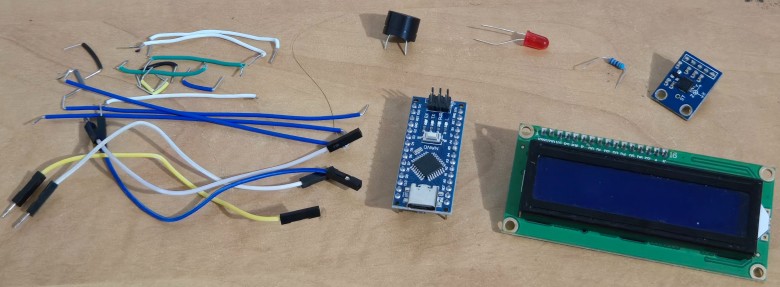
To make a DIY Arduino Seismograph, we will need the following components.
| S.N. | Components Name | Quantity | Purchase Link |
|---|---|---|---|
| 1 | Arduino Nano Board | 1 | Amazon | AliExpress |
| 2 | ADXL335 Accelerometer | 1 | Amazon | AliExpress |
| 3 | 16x2 I2C LCD Display | 1 | Amazon | AliExpress |
| 4 | Buzzer | 1 | Amazon | AliExpress |
| 5 | LED Red | 1 | Amazon | AliExpress |
| 6 | Resistor 330-ohm | 1 | Amazon | AliExpress |
| 7 | Connecting Wires | 10 | Amazon | AliExpress |
| 8 | Breadboard | 1 | Amazon | AliExpress |
Hardware & Circuit for Arduino Earthquake Detector
Here is the circuit diagram that represents the hardware connections for an Arduino-based Earthquake Detector with an ADXL335 accelerometer, an LCD display, a buzzer, and an LED indicator.
The central microcontroller processes data from the ADXL335 accelerometer and controls the display, buzzer, and LED.

The connection between Arduino and all other components is very simple as explained here:
- ADXL335 Accelerometer:
- X, Y, Z Pins: Connected to Arduino’s analog input pins (A0, A1, and A2) to read acceleration values along three axes.
- GND: Connected to the Arduino’s GND pin.
- VCC: Connected to the Arduino’s 5V pin for power.
- 16×2 LCD Display:
- Used to display the acceleration values and alerts.
- VCC and GND: Connected to the Arduino’s 5V and GND, respectively.
- SDA (Serial Data): Connected to Arduino’s A4 pin for I2C communication.
- SCL (Serial Clock): Connected to Arduino’s A5 pin for I2C communication.
- Buzzer:
- Connected to a digital pin 2 on the Arduino to emit sound when the detected shaking exceeds the threshold.
- The positive terminal is connected via a resistor to the digital pin, and the negative terminal is connected to GND.
- LED Indicator:
- Used to visually indicate an earthquake event or threshold breach.
- The LED’s positive terminal is connected to another digital pin 3 via a 330-ohm resistor, while the negative terminal is connected to GND.
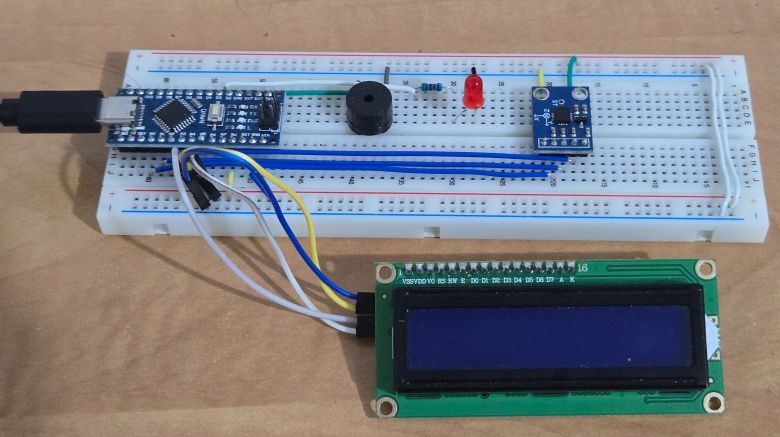
You can use a breadboard to place all the components together and connect it using jumper wires.
Arduino C++ Code/Program
Here is a code for making an Earthquake Detector (DIY Seismograph) using Arduino & ADXL335 Accelerometer.
This code sets up an earthquake detector using an Arduino, an ADXL335 accelerometer, an LCD, a buzzer, and an LED. It starts by calibrating the accelerometer to get baseline values. The Arduino constantly checks for changes in X, Y, and Z axis values.
If the changes are too large (above the threshold), it detects an earthquake. When this happens, the buzzer and LED turn on, and the LCD shows a warning along with the sensor values. The normal readings are displayed when no earthquake is detected.
Copy the code and paste it on your Arduino IDE editor window.
|
1 2 3 4 5 6 7 8 9 10 11 12 13 14 15 16 17 18 19 20 21 22 23 24 25 26 27 28 29 30 31 32 33 34 35 36 37 38 39 40 41 42 43 44 45 46 47 48 49 50 51 52 53 54 55 56 57 58 59 60 61 62 63 64 65 66 67 68 69 70 71 72 73 74 75 76 77 78 79 80 81 82 83 84 85 86 87 88 89 90 91 92 93 94 95 96 97 98 99 100 101 102 103 104 105 106 107 108 109 110 111 112 113 114 115 116 117 118 119 120 121 122 123 124 125 126 127 128 129 130 131 132 133 134 135 136 137 138 139 140 141 142 143 144 145 146 147 148 149 150 151 152 153 154 155 156 157 158 159 160 161 162 163 164 165 166 167 168 |
#include <Wire.h> #include <LiquidCrystal_I2C.h> // Initialize the LCD with I2C address 0x27, 16 columns, and 2 rows LiquidCrystal_I2C lcd(0x27, 16, 2); #define buzzer 2 // Pin connected to the buzzer #define led 3 // Pin connected to the LED // Pins connected to the x, y, and z outputs of the ADXL335 accelerometer #define x A0 #define y A1 #define z A2 /* Variables */ int xsample = 0; // Stores average calibration value for X-axis int ysample = 0; // Stores average calibration value for Y-axis int zsample = 0; // Stores average calibration value for Z-axis long start; // Stores the start time for the buzzer/LED alert int buz = 0; // Flag to indicate buzzer/LED state (on/off) /* Macros */ #define samples 50 // Number of samples to average during calibration #define maxVal 20 // Maximum allowed change in readings #define minVal -20 // Minimum allowed change in readings #define buzTime 5000 // Duration for which the buzzer/LED stays on void setup() { lcd.init(); // Initialize the LCD lcd.backlight(); // Turn on the LCD backlight Serial.begin(9600); // Initialize serial communication delay(1000); // Display initial messages Serial.println("System Initialized..."); lcd.print("EarthQuake "); lcd.setCursor(0, 1); lcd.print("Detector "); delay(2000); lcd.clear(); lcd.print("Calibrating....."); lcd.setCursor(0, 1); lcd.print("Please wait..."); // Configure buzzer and LED pins as outputs pinMode(buzzer, OUTPUT); pinMode(led, OUTPUT); buz = 0; // Initialize buzzer/LED state digitalWrite(led, buz); // Calibration process: Take multiple samples and calculate averages Serial.println("Calibration Started..."); for (int i = 0; i < samples; i++) { xsample += analogRead(x); // Read and accumulate X-axis values ysample += analogRead(y); // Read and accumulate Y-axis values zsample += analogRead(z); // Read and accumulate Z-axis values } // Calculate the average values for X, Y, and Z axes xsample /= samples; ysample /= samples; zsample /= samples; // Indicate calibration completion delay(3000); lcd.clear(); lcd.print("Calibrated"); delay(1000); Serial.println("Calibration Complete!"); Serial.println("Baseline Values:"); Serial.print("X Baseline: "); Serial.println(xsample); Serial.print("Y Baseline: "); Serial.println(ysample); Serial.print("Z Baseline: "); Serial.println(zsample); lcd.clear(); lcd.print("Device Ready"); delay(1000); // Display column headers for X, Y, and Z values lcd.clear(); lcd.print(" X Y Z "); } void loop() { // Read accelerometer values int value1 = analogRead(x); // Current reading for X-axis int value2 = analogRead(y); // Current reading for Y-axis int value3 = analogRead(z); // Current reading for Z-axis // Calculate change in accelerometer values int xValue = xsample - value1; int yValue = ysample - value2; int zValue = zsample - value3; // Calculate magnitude of vibration int magnitude = sqrt(sq(xValue) + sq(yValue) + sq(zValue)); // Check if an earthquake is detected if (xValue < minVal || xValue > maxVal || yValue < minVal || yValue > maxVal || zValue < minVal || zValue > maxVal) { if (buz == 0) { start = millis(); // Start timer for alert duration buz = 1; // Activate buzzer/LED Serial.println("Earthquake Detected! Alert Activated."); // Display earthquake alert on LCD lcd.clear(); lcd.print("Earthquake !!!!"); } // Display X, Y, Z values on the second line during earthquake detection lcd.setCursor(0, 1); lcd.print(padValue(xValue)); // X value at column 0 lcd.setCursor(6, 1); lcd.print(padValue(yValue)); // Y value at column 6 lcd.setCursor(11, 1); lcd.print(padValue(zValue)); // Z value at column 11 // Send X, Y, Z values to Serial Monitor Serial.print("Earthquake: X: "); Serial.print(xValue); Serial.print(" | Y: "); Serial.print(yValue); Serial.print(" | Z: "); Serial.print(zValue); Serial.print(" | Magnitude: "); Serial.println(magnitude); // Turn on LED and buzzer digitalWrite(led, HIGH); tone(buzzer, 1000); // Turn off alert after buzzer time if (millis() >= start + buzTime) { buz = 0; noTone(buzzer); digitalWrite(led, LOW); Serial.println("Alert Deactivated: Buzzer and LED OFF"); // Restore normal display lcd.clear(); lcd.print(" X Y Z "); } // Skip further updates during alert return; } // Display X, Y, Z values on the second line during normal operation lcd.setCursor(0, 1); lcd.print(padValue(xValue)); // X value at column 0 lcd.setCursor(6, 1); lcd.print(padValue(yValue)); // Y value at column 6 lcd.setCursor(11, 1); lcd.print(padValue(zValue)); // Z value at column 11 // Send X, Y, Z values to Serial Monitor Serial.print("Normal: X: "); Serial.print(xValue); Serial.print(" | Y: "); Serial.print(yValue); Serial.print(" | Z: "); Serial.print(zValue); Serial.print(" | Magnitude: "); Serial.println(magnitude); delay(150); // Delay for stable readings } // Function to pad values for LCD display String padValue(int value) { String strValue = String(value); while (strValue.length() < 4) { // Pad with spaces to ensure proper alignment strValue += " "; } return strValue.substring(0, 4); // Truncate to ensure exact 4 characters } |
Testing the DIY Seismometer Working
Upload the above code to the Arduino Board. Then you can start testing the Arduino Earthquake Detector project. On the Serial Monitor, the following messages will be displayed.
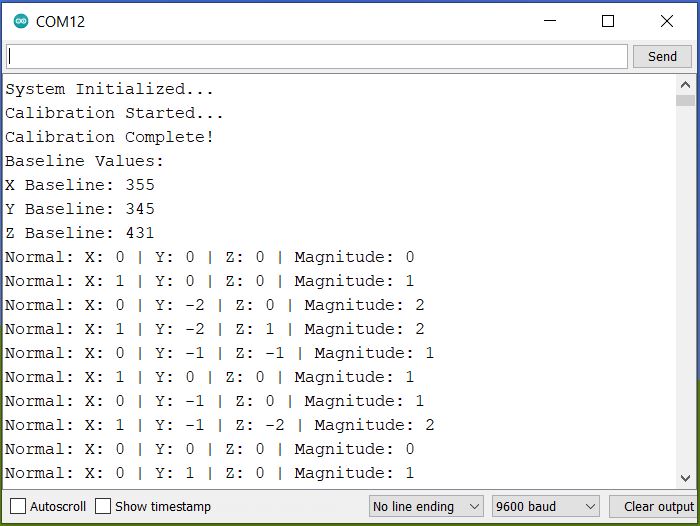
The system will initialize first. Then the calibration will start. After a few seconds, the calibration will complete. Then it will print the baseline values which are used for calculating the magnitude and comparison.
Then it will print the Accelerometer values as shown above. When the sensor is stable the X, Y, and Z values will almost appear zero.
When you shake the sensor or tremble it, there will be changes in x, y, and z values as shown below.
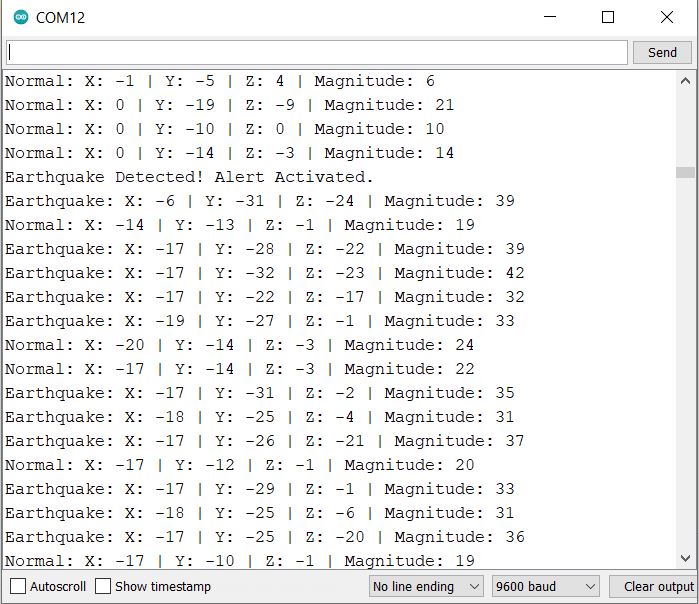 If the threshold is exceeded, the Serial Monitor will print the Earthquake Detected message.
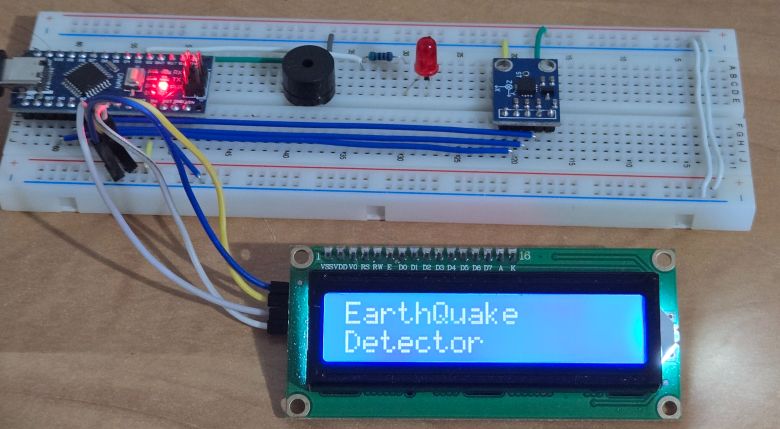
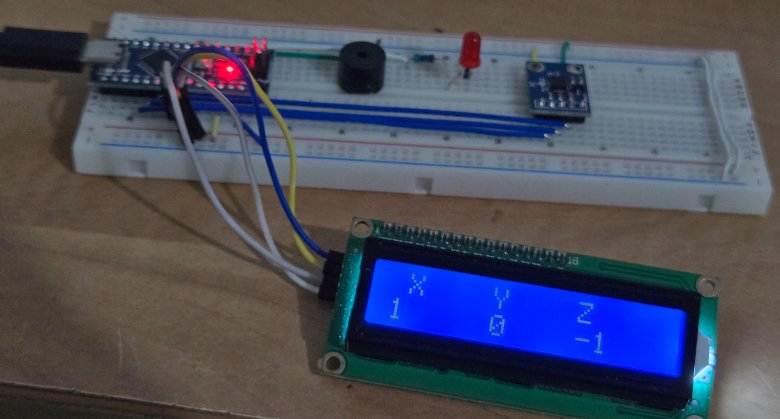
Similarly, if you check the LCD side on the hardware part, it will initialize with this message.
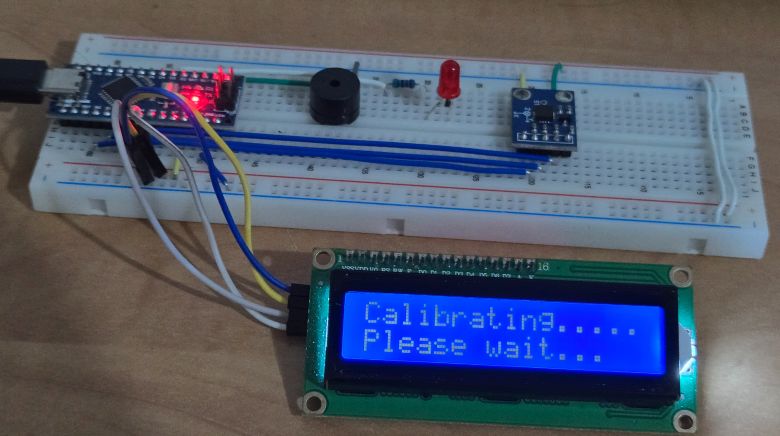
Then the LCD will display the Calibration message. During the calibration phase, keep the ADXL335 accelerometer still.
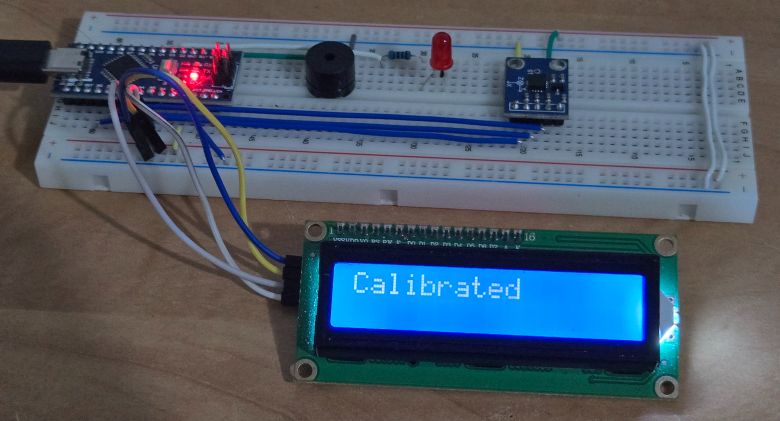
Once, Calibration is done, the LCD will display the calibrated message.
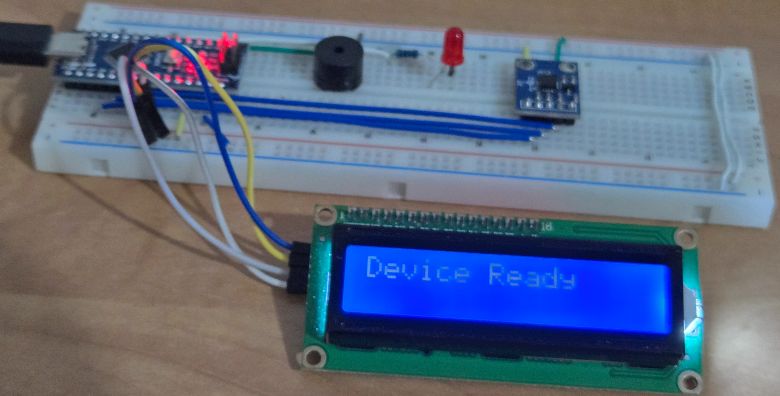
Finally, after calibration, the device is ready for testing. It will show device device-ready message.
After this step, the LCD will show the X, Y, and Z values.
Lightly tilt, shake, or move the accelerometer module to simulate vibrations or an earthquake. Observe the LED and buzzer. They should activate if the movement exceeds the set threshold values in the code.

The LCD should display “Earthquake !!!” and show the X, Y, and Z values. Check the Serial Monitor to confirm the values match the movement you simulated.
Visualizing Seismic Graph using the Python Code
The above C++ code only shows the values of X, Y, Z on LCD screen. It only compares the threshold value and shows Earthquake Detection on LCD Screen.
For visualizing, we need to plot some graph based on x, y, z data’s. Therefore we will write a Python Script that can visualize the ADXL335 Accelerometer data.
For running the Python Code, I am using PyCharm. You may use any other Python compiler.
This Python code visualizes real-time acceleration data (X, Y, Z axes) from an Arduino-based earthquake detector on a graph. It reads data from the serial port, processes it to detect earthquakes, and plots the acceleration values over time using Matplotlib.
If an earthquake is detected, the graph displays a warning, and the acceleration values are updated continuously to monitor the shaking intensity. The system also logs data and visualizes smooth curves for better analysis.
Install the required Python libraries:
|
1 |
pip install matplotlib pyserial |
Update the serial_port in the Python code with the correct port for your Arduino (e.g., COM12 on Windows or /dev/ttyUSB0 on Linux/Mac).
Copy the following code and paste it in a Python Compiler Editor window.
|
1 2 3 4 5 6 7 8 9 10 11 12 13 14 15 16 17 18 19 20 21 22 23 24 25 26 27 28 29 30 31 32 33 34 35 36 37 38 39 40 41 42 43 44 45 46 47 48 49 50 51 52 53 54 55 56 57 58 59 60 61 62 63 64 65 66 67 68 69 70 71 72 73 74 75 76 77 78 79 80 81 82 83 84 85 86 87 88 89 90 91 92 93 94 95 96 97 98 99 100 101 102 103 104 105 106 107 108 109 110 111 112 113 114 115 116 117 118 119 120 121 122 123 |
import serial import matplotlib.pyplot as plt import matplotlib.animation as animation from collections import deque import time # Serial port settings serial_port = 'COM12' # Replace with your actual COM port baud_rate = 9600 # Initialize serial connection ser = serial.Serial(serial_port, baud_rate, timeout=1) # Data queues for X, Y, Z values x_data = deque(maxlen=100) y_data = deque(maxlen=100) z_data = deque(maxlen=100) time_data = deque(maxlen=100) # Time axis # Initialize time counter time_counter = 0 # Flags for earthquake detection earthquake_detected = False alert_end_time = 0 # Timestamp for when the alert ends # Last X, Y, Z values for real-time display last_x = 0 last_y = 0 last_z = 0 def parse_serial_data(serial_line): """ Parse the serial data string and extract X, Y, Z values. """ global earthquake_detected, alert_end_time try: if "Earthquake Detected!" in serial_line: earthquake_detected = True alert_end_time = time.time() + 5 # Set alert duration to 5 seconds print("EARTHQUAKE DETECTED!") elif "Normal:" in serial_line: parts = serial_line.split('|') x_value = int(parts[0].split(':')[-1].strip()) y_value = int(parts[1].split(':')[-1].strip()) z_value = int(parts[2].split(':')[-1].strip()) return x_value, y_value, z_value except (IndexError, ValueError) as e: print(f"Error parsing serial data: {e}") return None, None, None def update_plot(frame): """ Update the Matplotlib plot with new data. """ global time_counter, earthquake_detected, alert_end_time, last_x, last_y, last_z # Read serial data if ser.in_waiting > 0: try: serial_line = ser.readline().decode('utf-8', errors='ignore').strip() # Handle non-UTF-8 bytes print("Serial Line:", serial_line) x_value, y_value, z_value = parse_serial_data(serial_line) if x_value is not None and y_value is not None and z_value is not None: x_data.append(x_value) y_data.append(y_value) z_data.append(z_value) time_data.append(time_counter) time_counter += 1 # Update the last X, Y, Z values last_x, last_y, last_z = x_value, y_value, z_value except Exception as e: print(f"Error reading serial data: {e}") # Clear axes ax.clear() # Plot X, Y, Z values with smooth curves ax.plot(time_data, x_data, label='X (Blue)', color='blue', linewidth=2, alpha=0.8) ax.plot(time_data, y_data, label='Y (Green)', color='green', linewidth=2, alpha=0.8) ax.plot(time_data, z_data, label='Z (Red)', color='red', linewidth=2, alpha=0.8) # Add earthquake alert if earthquake_detected: ax.set_title("⚠️ EARTHQUAKE DETECTED! ⚠️", fontsize=18, color='red', fontweight='bold') if time.time() > alert_end_time: earthquake_detected = False else: ax.set_title("Real-Time Earthquake Visualization", fontsize=16, color='darkblue', fontweight='bold') # Display real-time X, Y, Z values on the right side of the graph ax.text(0.92, 0.9, f"X: {last_x}", transform=ax.transAxes, fontsize=12, color='blue', fontweight='bold') ax.text(0.92, 0.85, f"Y: {last_y}", transform=ax.transAxes, fontsize=12, color='green', fontweight='bold') ax.text(0.92, 0.8, f"Z: {last_z}", transform=ax.transAxes, fontsize=12, color='red', fontweight='bold') # Add labels and legend ax.set_xlabel("Time (s)", fontsize=12, fontweight='bold') ax.set_ylabel("Acceleration (G)", fontsize=12, fontweight='bold') ax.legend(loc="upper left", fontsize=10, frameon=True, facecolor='lightgray', edgecolor='black') ax.grid(True, linestyle='--', alpha=0.6) ax.set_ylim(-30, 30) # Adjust based on your data range # Set up Matplotlib figure and axes fig, ax = plt.subplots(figsize=(12, 6)) # Add a background color to the plot fig.patch.set_facecolor('#f5f5f5') ax.set_facecolor('#ffffff') # Create an animation ani = animation.FuncAnimation(fig, update_plot, interval=100, cache_frame_data=False) # Update every 100ms # Show the plot plt.tight_layout() plt.show() # Close the serial connection on exit ser.close() |
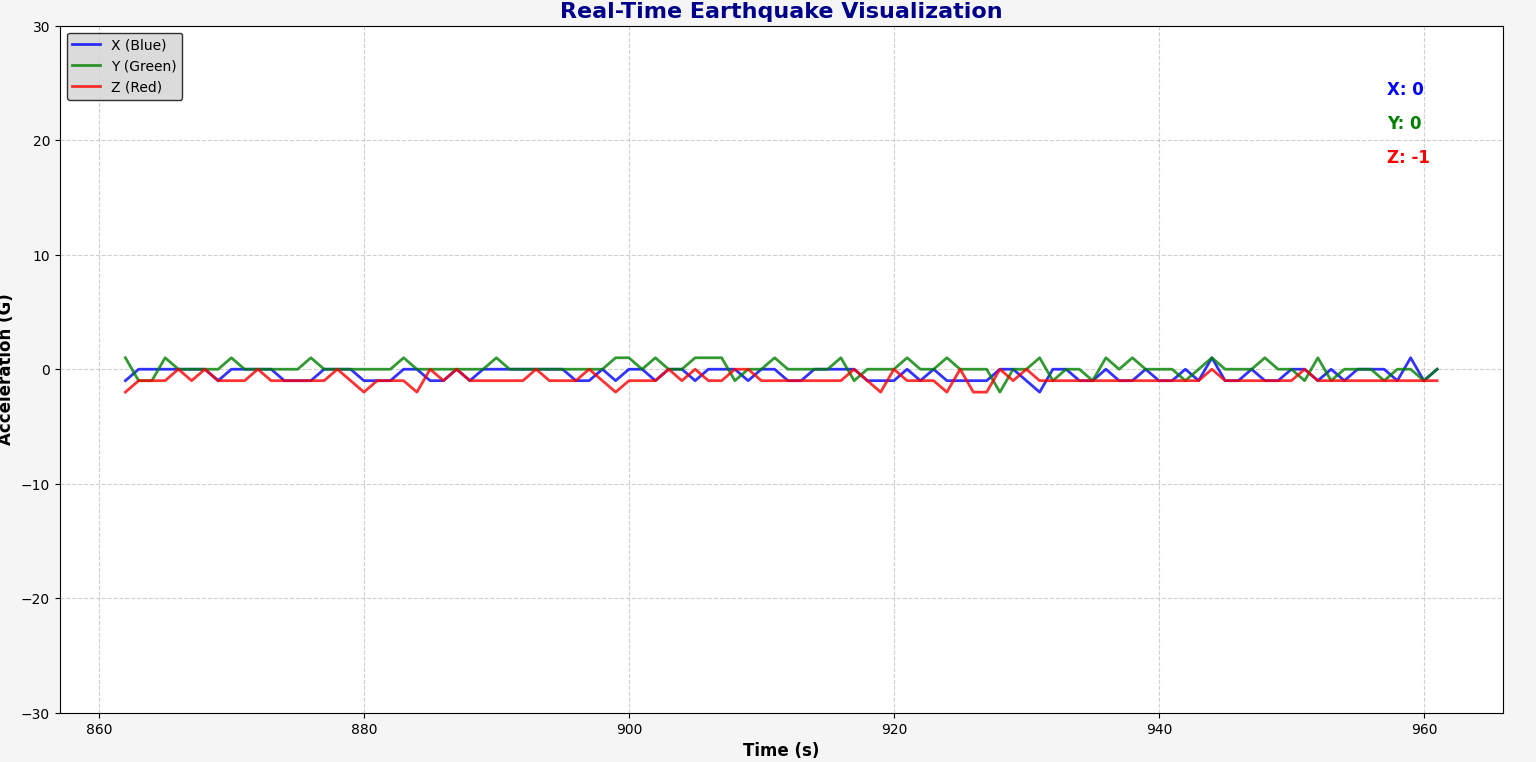
Run the Python Code now. The Matplotlib window will pop up where it shows the graph.
Under Normal test mode, Leave the accelerometer stationary. The graph should stabilize, showing minimal fluctuations in X, Y, and Z values.
Gently tilt or shake the ADXL335 sensor to generate acceleration data along the X, Y, and Z axes. Observe the graph to see the real-time data update. The curves for X, Y, and Z should change as you move the sensor.
Simulate an earthquake by shaking the accelerometer rapidly. The graph should display an earthquake alert, and the corresponding X, Y, Z values should spike on the graph.
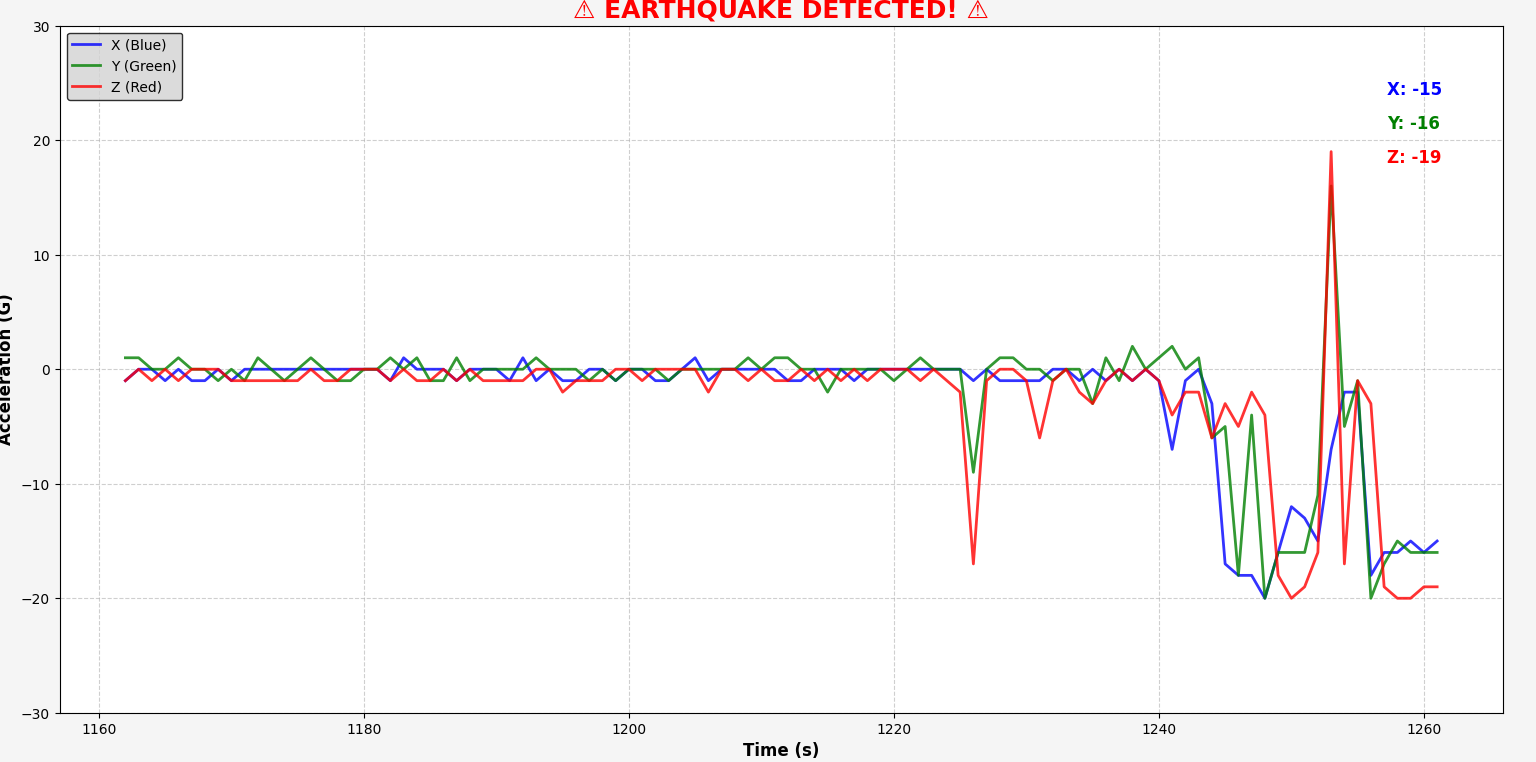
By following these steps, you can verify that the graph correctly visualizes the real-time accelerometer data and responds to simulated earthquake events.
Video Tutorial & Guide


")


6 Comments
Does it work all day long?
It will work for several years too
Can I ask what is wrong if after shaking the accelerometer then placing it t rest, the buzzer won’t stop
Good work !!! is there a possibility to record on an SD card?
how to change the graph time duration, …ie graph a longer time frame
which adapter should be used