

Overview
In this guide, we will learn about the 2.4GHz Portable Spectrum Analyzer USB Dongle from iFrogLab. A spectrum analyzer is a device that displays a spectrum of signal amplitudes on different frequencies. It enables analysis that determines whether signals fall within required limits.
The 2.4GHz Spectrum Analyzer has a USB interface and is compact and portable. You can insert it into the USB port of your PC/Laptop. By setting the application provided by the iFrogLab, you can visualize the spectrum. This application is meant to simulate the functionality of a spectrum analyzer. This application simulates the functionality by reading signal strength indicator values from a Texas Instruments chip. The value is called RSSI (Received Signal Strength Indicator).
2.4GHz Frequency & its Applications
The 2.4GHz frequency channel means, the frequency range is from 2.4 to 2.4835 GHz, which is unlicensed and used for many communications applications.

There are several uses of the 2.4 GHz band.
- Many cordless telephones and baby monitors use a 2.4GHz Frequency band for communication.
- Bluetooth devices intended for use in short-range personal area networks operate from 2.4 to 2.4835 GHz.
- Wi-Fi most commonly uses the 2.4 gigahertz (12 cm) ISM radio bands.
- Many ZigBee / IEEE 802.15.4-based wireless data networks operate in the 2.4–2.4835 GHz band.
- Some wireless peripherals like keyboards and mice use the 2.4 GHz band with a proprietary protocol.
- Microwave ovens operate by emitting a very high power signal in the 2.4 GHz band.
- Many radio-controlled drones, model aircraft, model boats, and toys use the 2.4 GHz band.
- Some radars use the 2.4 GHz band.
- Some new truly wireless power transmission uses the 2.4 GHz band.
What is Spectrum Analyzer?
A spectrum analyzer is a device that measures and displays signal amplitude (strength) as it varies by frequency within its frequency range (spectrum). The frequency appears on the horizontal (X) axis, and the amplitude is displayed on the vertical (Y) axis. It looks like an oscilloscope, and in fact, some devices can function as either oscilloscopes or spectrum analyzers.
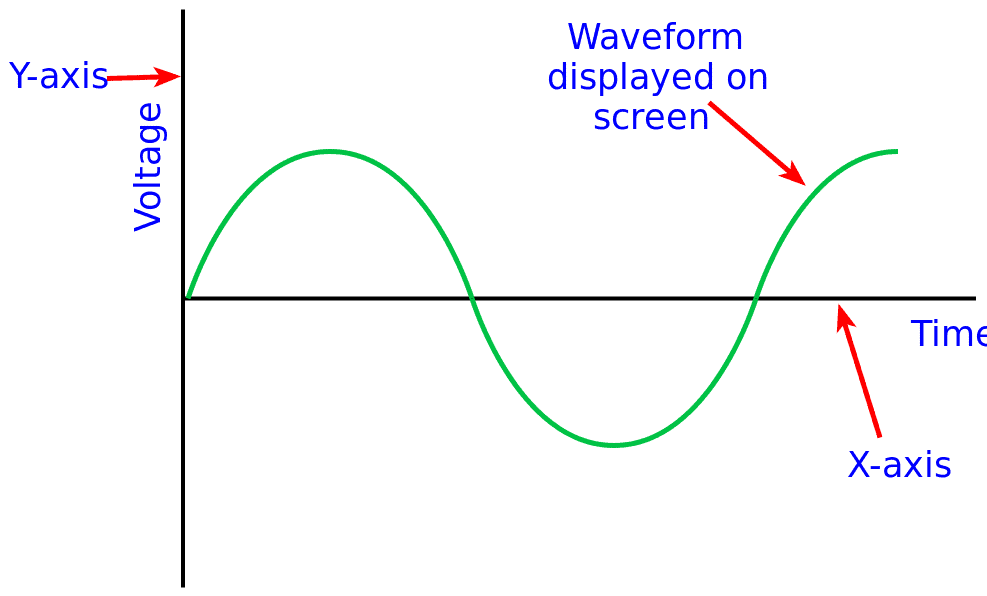
When looking at the spectrum of a signal, the amplitude of signals is displayed on the vertical axis, and frequency on the horizontal axis – signals are displayed in the frequency domain. By looking at the amplitudes of signals at different frequencies it is possible to measure the amplitudes of these signals, find what signals are present, and the like.
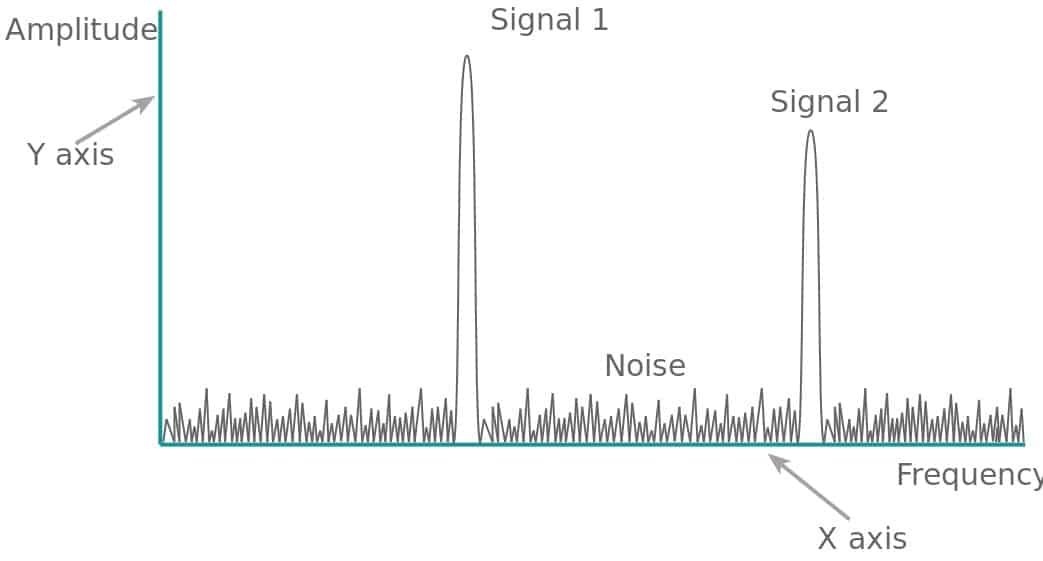
A spectrum analyzer displays a spectrum of signal amplitudes on different frequencies. It enables analysis that determines whether signals fall within required limits. It displays spurious signals, complex waveforms, rare short-duration events, and noise. Spectrum analyzers can also analyze transient signals, capture burst transmissions and glitches, and show if stronger signals are masking weaker ones.
iFrogLab 2.4GHz Portable Spectrum Analyzer USB Dongle
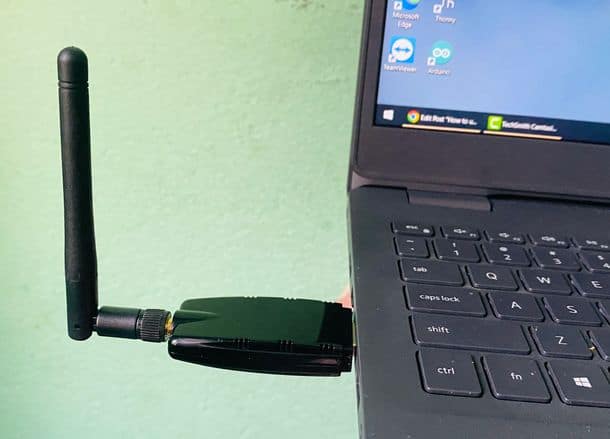
The 2.4GHz Spectrum Analyzer USB dongle is the size of a USB disk hardware box. It is ready for plug and play, making it extremely easy to connect to a PC and work. It covers the common 2.4GHz band and has detection bandwidth up to 80MHz.

The iFrogLab 2.4G Spectrum Analyzer USB dongle only costs around US$ 85.00. There is no need to spend US$1500 to buy the spectrum analyzer device as this device has all those features. You can purchase the 2.4GHz Spectrum Analyzer from TECHDesign official link.
Features
- 80MHz bandwidth covering the ISM band (2.4GHz ~ 2.48GHz),
- RF interface SMA interface, the maximum input power of 0dBm,
- CENTER, SPAN can be adjusted independently
- Support slide Marker, amplitude-frequency maximum, minimum display
- Spectrum grid blanking support, dynamic amplitude.
- Spectrum screen pause / resume;
- Support (single and continuous) triggering
- Application areas: Basic RF 2.4G band for debugging and testing (PA-power, nonlinear test);
- Conformance testing wireless products;
- Environmental wireless signal interference distribution;
- Performance testing of the wireless signal coverage
- Wireless product development aided testing
How to use 2.4GHz Portable Spectrum Analyzer USB Dongle?
When you unbox the product, you will see these two components
- 2.4G Spectrum Analyzer dongle
- 2.4G Antenna
Connect the Antenna with the dongle and plug the device into your PC USB slot.
Download iFrogLab RF Spectrum indicator program from the following link:
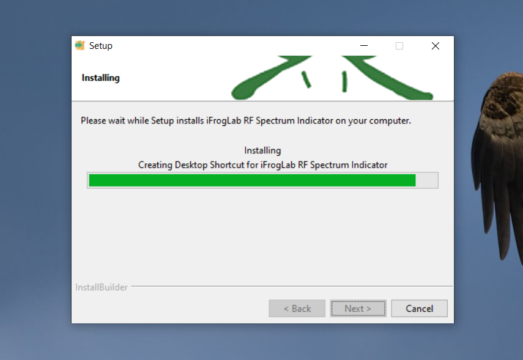
After downloading, extract the ZIP File and install it on your computer.
Open the Software and you will see the following interfaces.
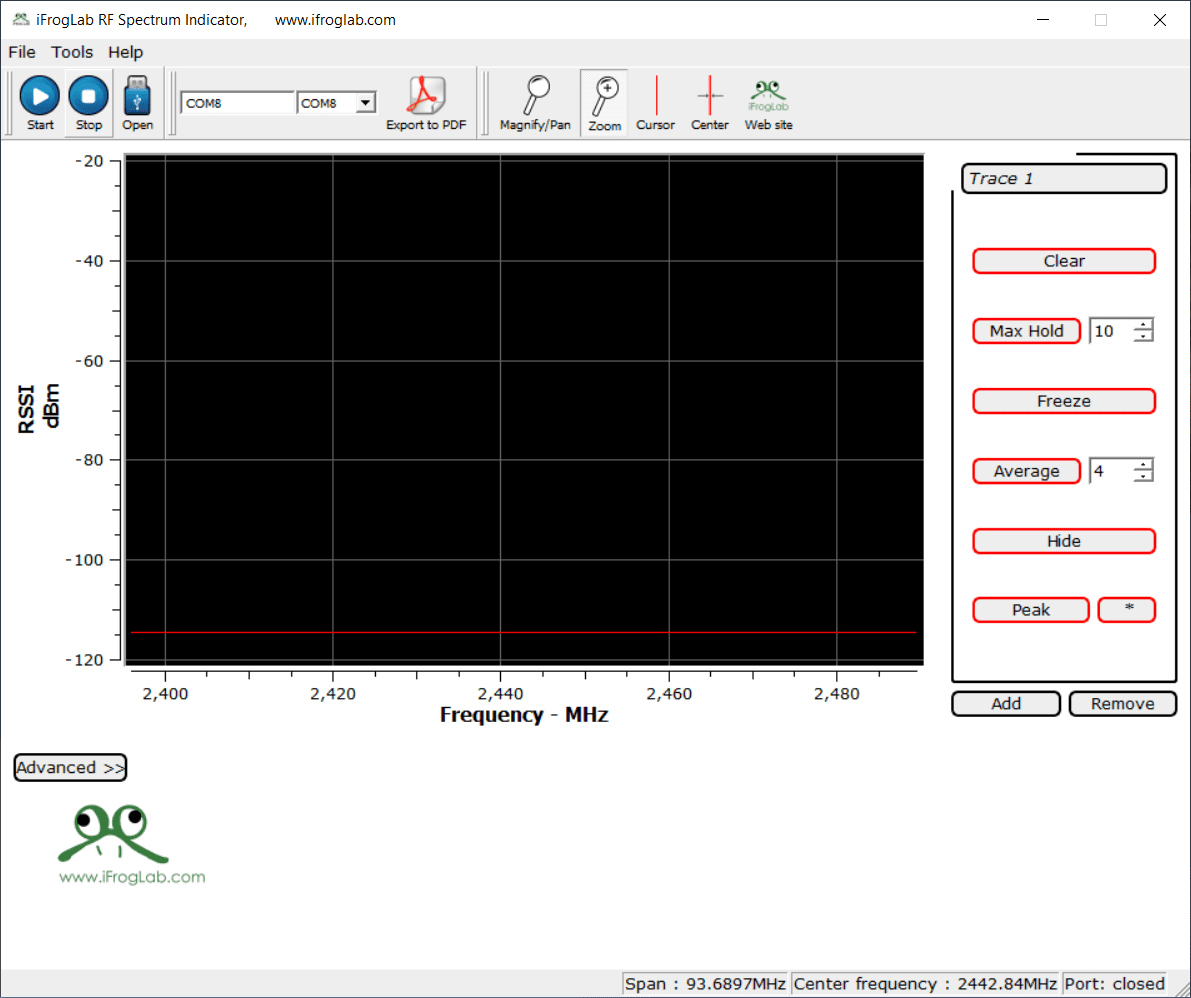
This application is meant to simulate the functionality of a spectrum analyzer. This application simulates the functionality by reading signal strength indicator values called RSSI (Received Signal Strength Indicator).
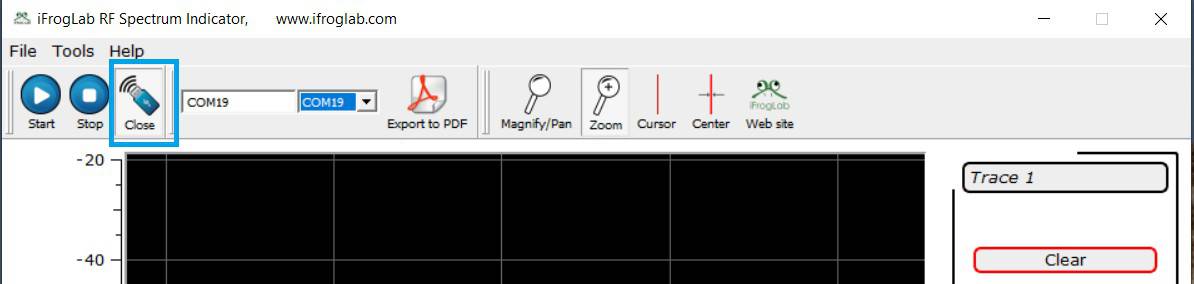
Check whether the device manager has recognized the dongle on the port(COM & LPT). Note down the COM port as this will be used in this software.
From the COM port list, select the COM port that your Spectrum Analyzer is connected to. In my case, it is connected to COM19.

Enable and click the Open button that will appear Close after enabling.
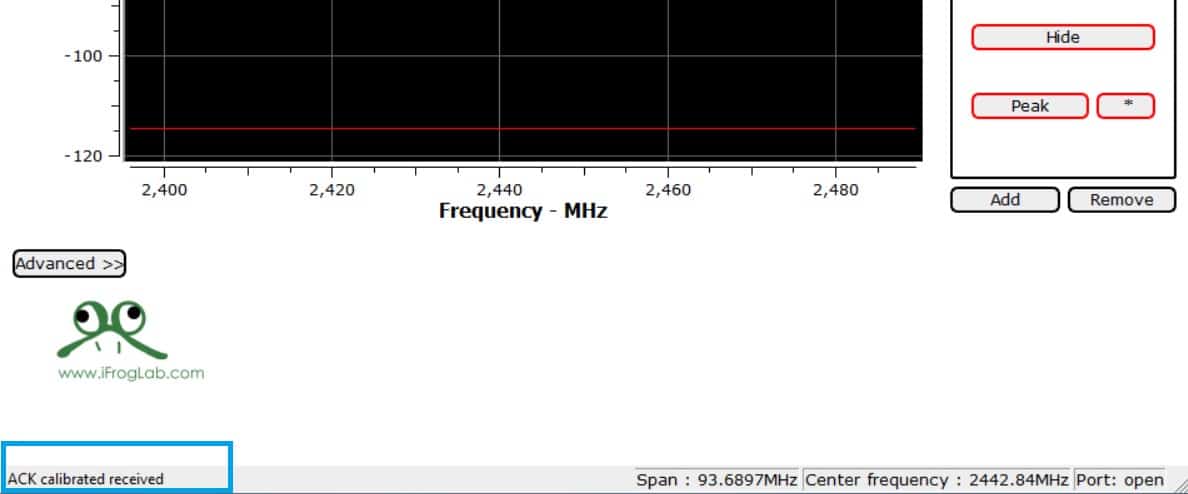
Go to Tools & click on Calibrate in order to Calibrate your Spectrum Analyzer.

Once calibration is done, “ACK Calibration Received” message will appear at bottom.
Congratulations you have successfully completed setup process of the dongle!
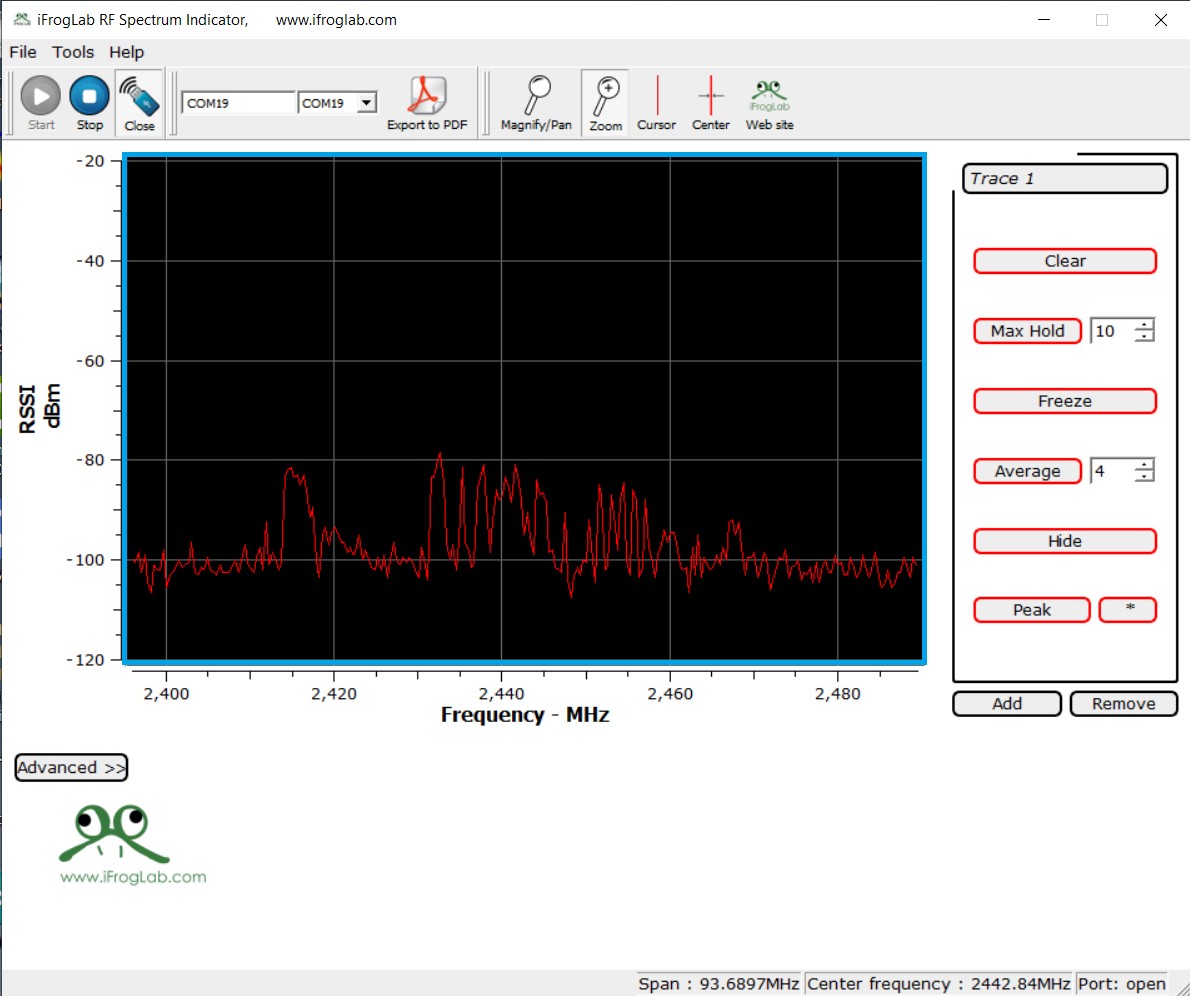
You can start to track any 2.4G signal after enabling “Start Button”
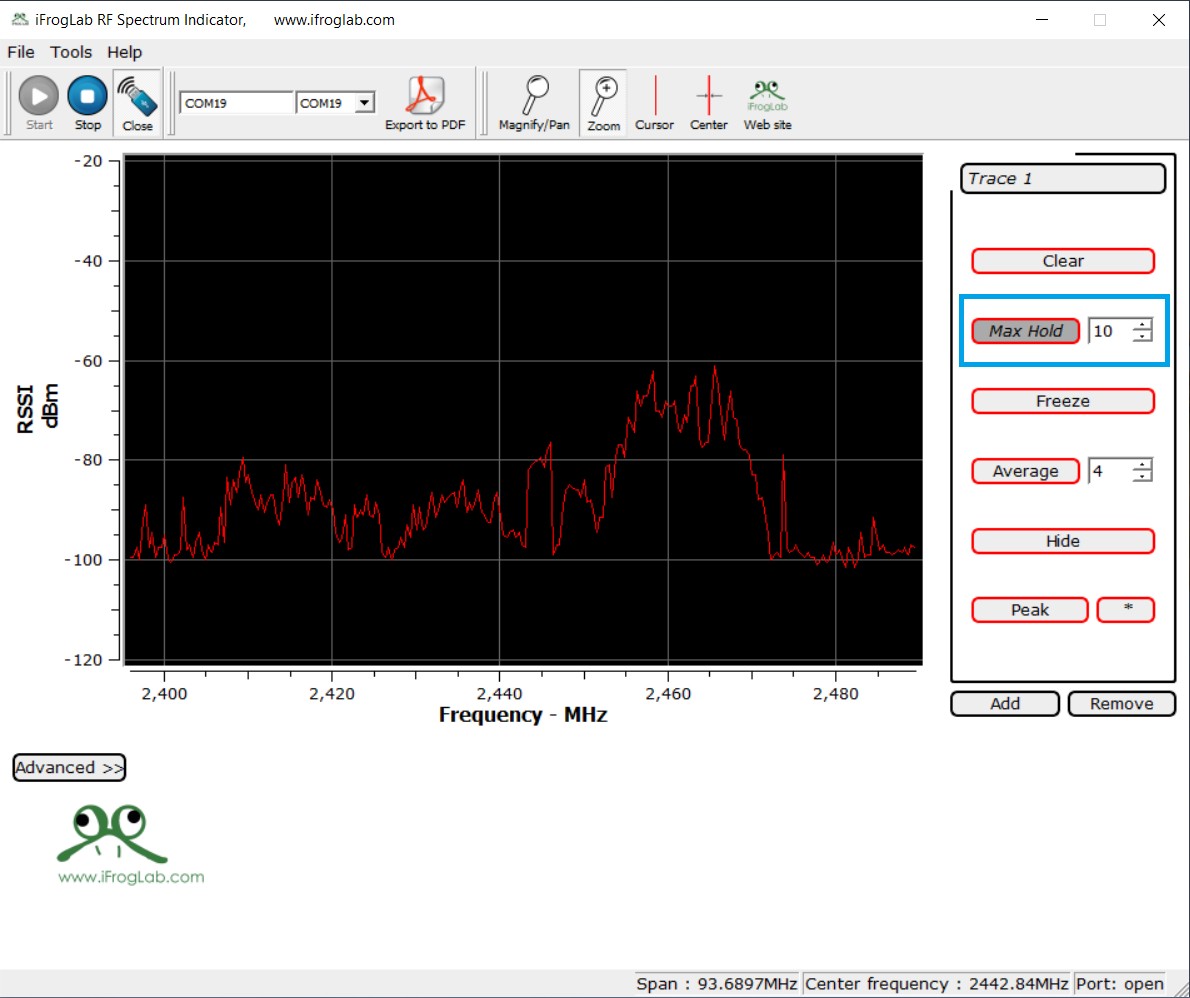
Max Hold: The curve is always displaying the maximum value of the latest samples. The number of samples to find the maximum value from is set in the spinbox on the right side of the Max Hold button.
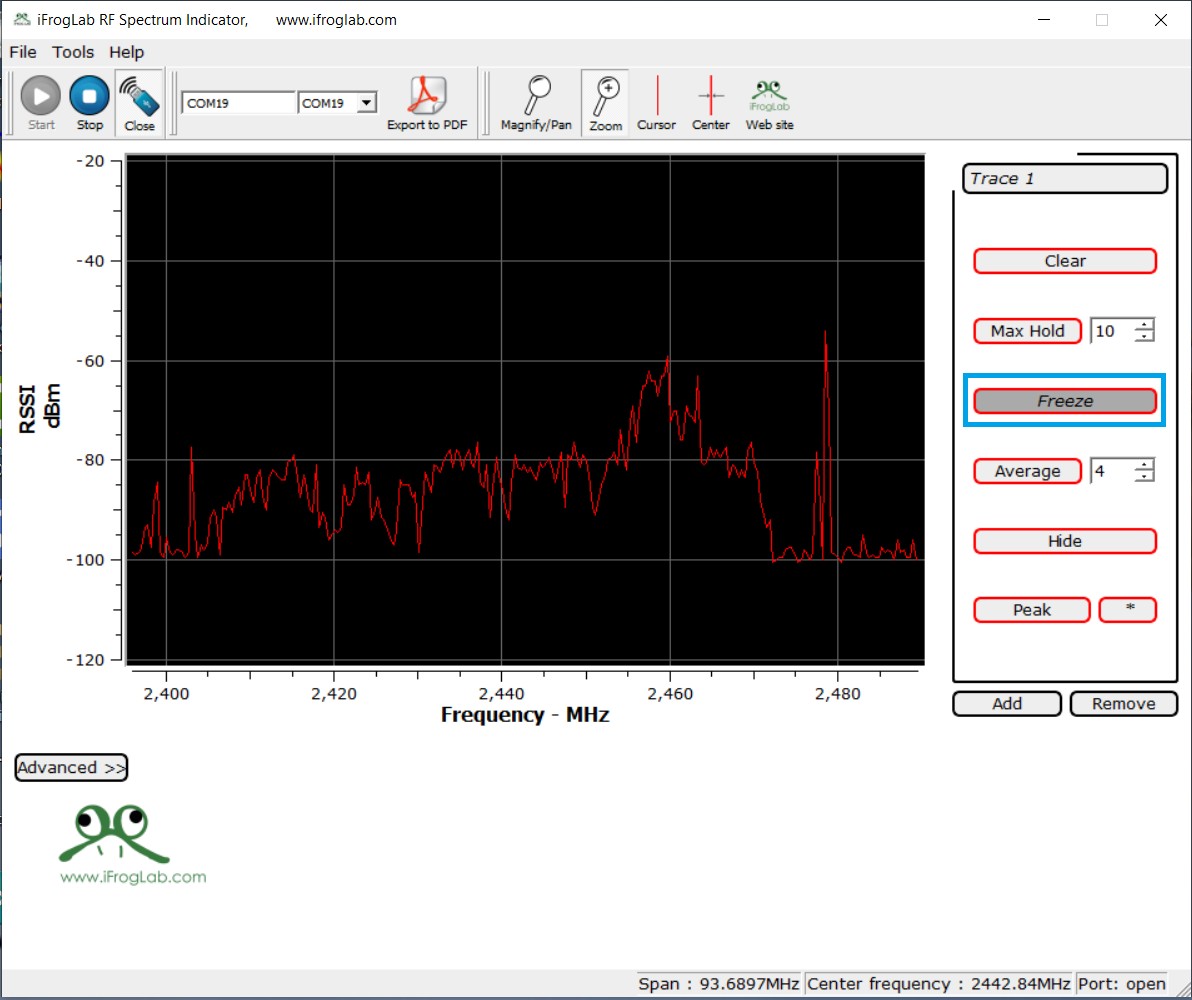
Freeze: The curve is no longer updated.
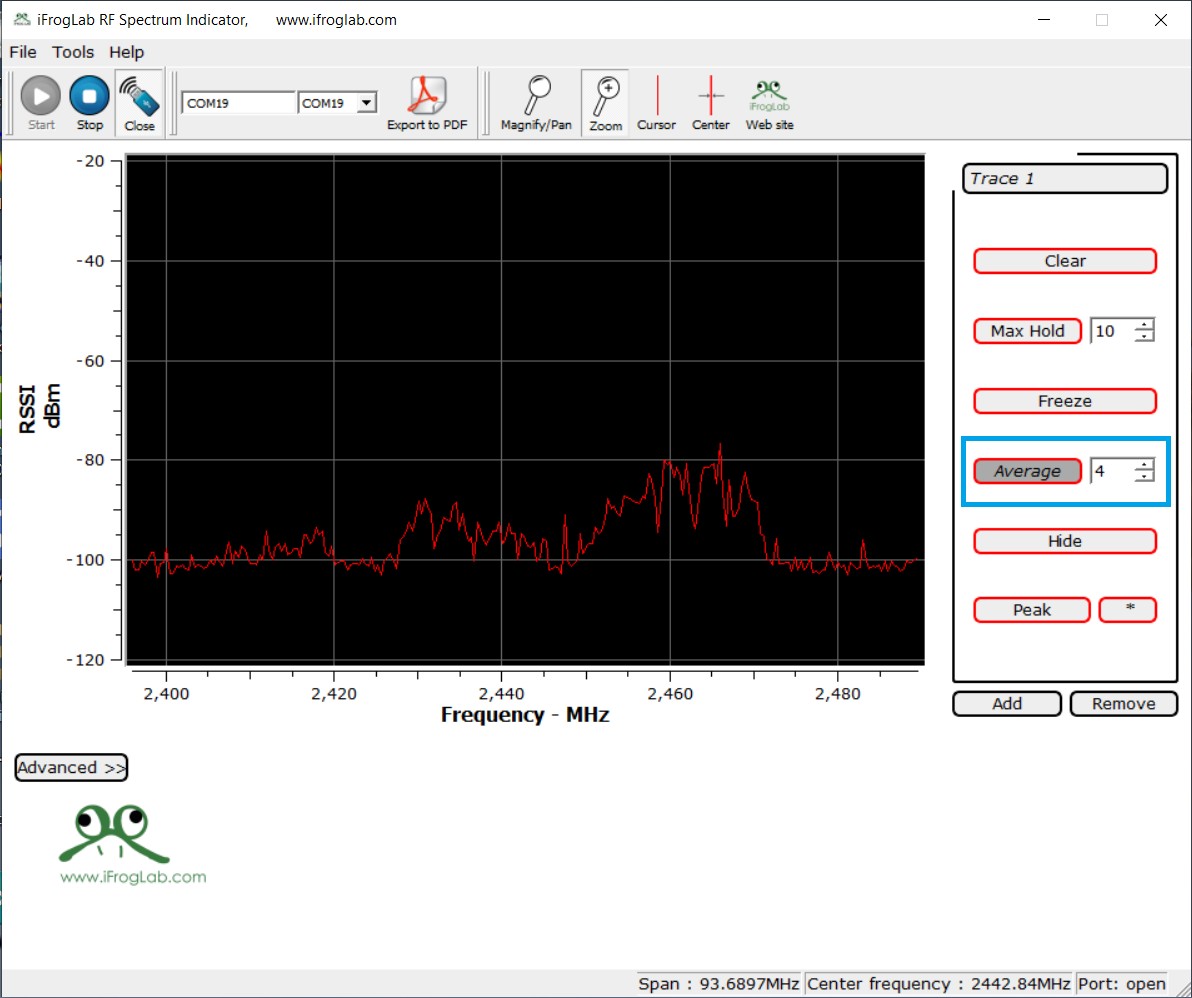
Average: The curve is displaying the average of the latest samples. The number of samples to average over is set in the spinbox on the right side of the Average button.
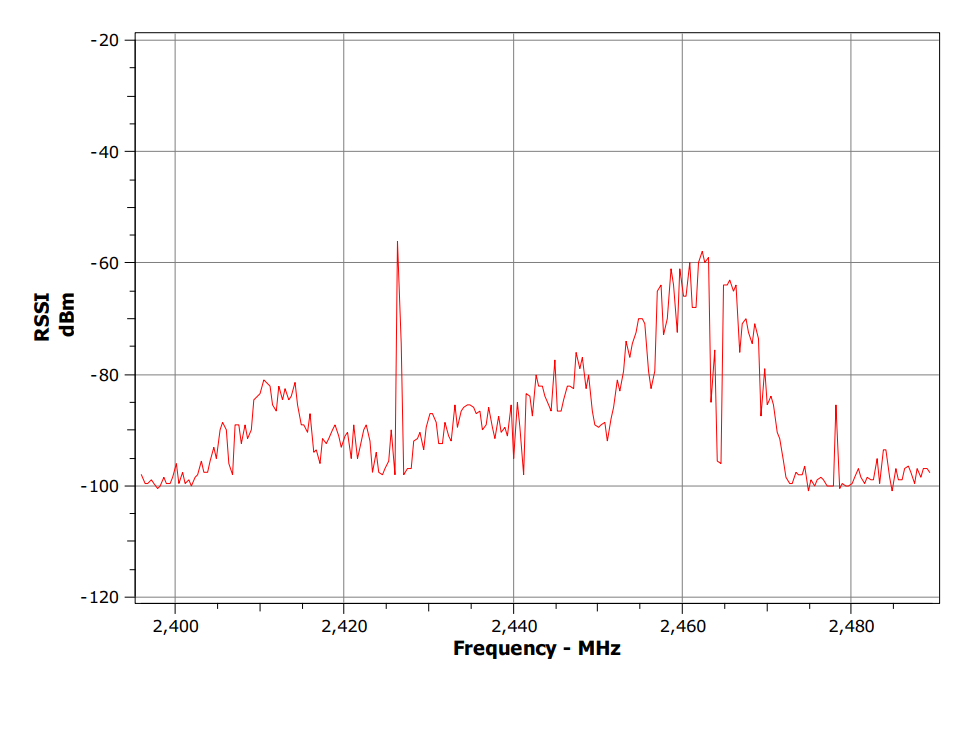
Export: The application support exporting the plot to pdf. The curves, cursors, markers, grid, scales and axis labels are exported as displayed in the application, except the black background.

The exported graph looks something like this:
Apart from all these, you can explore all other features of this software indicated in the software options.
That’s all about the low-cost alternative for spectrum analyzer equipment, portable and easy to connect to a PC.
Written Tutorial & Guide


