Close Menu
  • Articles
    • Learn Electronics
    • Product Review
    • Tech Articles
  • Electronics Circuits
    • 555 Timer Projects
    • Op-Amp Circuits
    • Power Electronics
  • Microcontrollers
    • Arduino Projects
    • STM32 Projects
    • AMB82-Mini IoT AI Camera
    • BLE Projects
  • IoT Projects
    • ESP8266 Projects
    • ESP32 Projects
    • ESP32 MicroPython
    • ESP32-CAM Projects
    • LoRa/LoRaWAN Projects
  • Raspberry Pi
    • Raspberry Pi Projects
    • Raspberry Pi Pico Projects
    • Raspberry Pi Pico W Projects
  • Electronics Calculator
Facebook X (Twitter) Instagram
  • About Us
  • Disclaimer
  • Privacy Policy
  • Contact Us
  • Advertise With Us
Facebook X (Twitter) Instagram Pinterest YouTube LinkedIn
How To Electronics
  • Articles
    • Learn Electronics
    • Product Review
    • Tech Articles
  • Electronics Circuits
    • 555 Timer Projects
    • Op-Amp Circuits
    • Power Electronics
  • Microcontrollers
    • Arduino Projects
    • STM32 Projects
    • AMB82-Mini IoT AI Camera
    • BLE Projects
  • IoT Projects
    • ESP8266 Projects
    • ESP32 Projects
    • ESP32 MicroPython
    • ESP32-CAM Projects
    • LoRa/LoRaWAN Projects
  • Raspberry Pi
    • Raspberry Pi Projects
    • Raspberry Pi Pico Projects
    • Raspberry Pi Pico W Projects
  • Electronics Calculator
How To Electronics
Home » Plotting Real-Time Graph from Bluetooth 5.0 to Google Chrome
BLE Projects

Plotting Real-Time Graph from Bluetooth 5.0 to Google Chrome

Mamtaz AlamBy Mamtaz AlamUpdated:August 20, 20223 Mins Read
Share Facebook Twitter LinkedIn Telegram Reddit WhatsApp
Plotting Graph Bluetooth 5.0
Share
Facebook Twitter LinkedIn Pinterest Email Reddit Telegram WhatsApp

Overview

This is the tutorial on Plotting Real-Time Graph from Bluetooth 5.0 Devices to Google Chrome. We will plot a real-time graph to Google Chrome from Hibou Air Quality Monitor using BleuIO and javascript library chartjs.

For this project, I am using a Bluetooth Low Energy USB dongle called BlueIO, which will act as a central device to retrieve data. Hibou Air Quality Monitor will serve as a peripheral device to transmit the data. The script is simple to use and can be used for other purposes such as showing real-time air quality data, temperate, humidity, pressure, particle matters, etc. The data could be later stored on a cloud service of choice.


Requirements

Here is a list of requirements which is required to start the project.

  • Google Chrome version 78 or later (windows)
  • BleuIO — Bluetooth Low Energy Adapter
  • HibouAir Quality Monitor sensor device


Plotting Real-Time Graph from Bluetooth 5.0 to Google Chrome

The article assumes you have some general knowledge of how Bluetooth Low Energy (BLE) works. You can follow our basic guide to learn more about Bluetooth Low Energy. If you have proper knowledge of BLE, then we can proceed with Plotting Real-Time Graph from Bluetooth 5.0 to Google Chrome.

Since the Chrome Serial specification on Google Chrome is not finalized yet, you will have to go to enable the highlighted flag, and restart Chrome. To do that open chrome://flags/#enable-experimental-web-platform-features in chrome browser.

In this example, we are going to use JavaScript + HTML (and some CSS for styling) to set up the BleuIO and quickly start scanning.


Step 1:

Clone this repository from following link

1
https://github.com/smart-sensor-devices-ab/Web-Hibou-Sensor-Plotter.git

Using git clone, clone the following.

1
https://github.com/smart-sensor-devices-ab/Web-Hibou-Sensor-Plotter.git


Step 2:

Once you have everything ready, open the index.html file. Your page should look like this

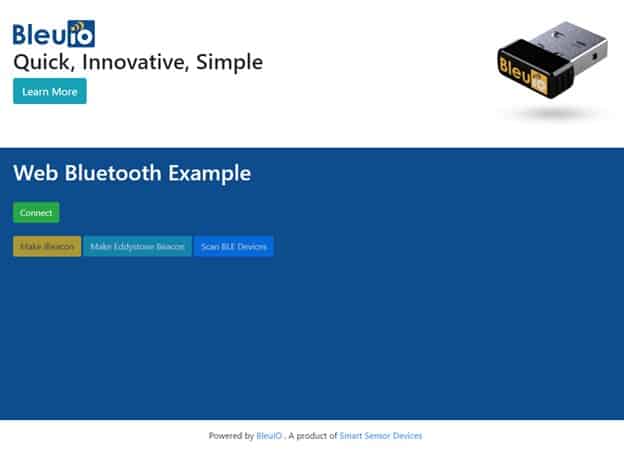
Now connect your BleuIO device to your computer and click connect. Wait for your device to show up on the port screen.

Select your device and press connect.

Once the device is connected, you can scan for nearby devices. For this project, I have added a filter so that it will only look for Hibou BLE devices. You will see a list of devices on the dropdown menu. We have a small console on the page that shows scan status and the number of devices found. Now you can select a device from the dropdown and start getting data from the device.

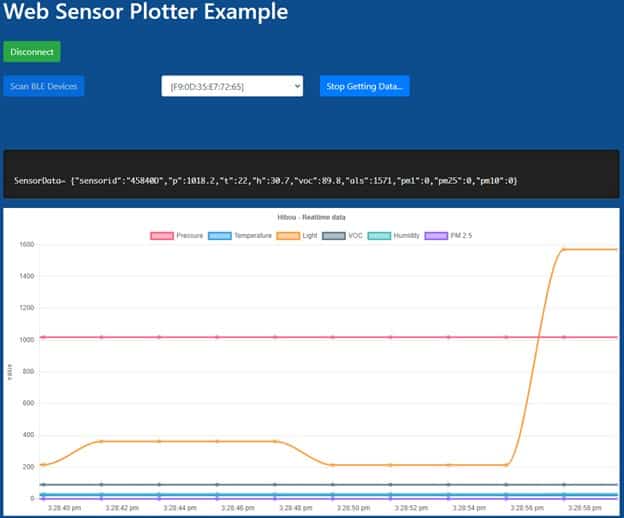
Once you click on get data after selecting a device, it will start to generate graphs using chartjs using real-time data from Hibou Air Quality Monitor.

In my script, I am showing Pressure, Temperature, ALS, VOC, Humidity, PM2.5. You can customize your own chart by updating values. All the codes for charts are available on script.js.


Results & Testing

Here is our real time chart showing on web browser.

Plot Graph Bluetooth 5.0

So this is how you can plot a real-time graph from Bluetooth 5.0 device to Google Chrome.


Video Tutorial & Guide

Follow the video tutorial to learn about Plotting of Real-Time Graph from Bluetooth 5.0 to Google Chrome incase if you face any difficulty.

Plotting real-time graph from Bluetooth 5.0 device to Google Chrome
Watch this video on YouTube.

Share. Facebook Twitter Pinterest LinkedIn Tumblr Email Reddit Telegram WhatsApp
Previous ArticleHow to send BLE data to Google Firebase Cloud
Next Article How to make Simple Bluetooth Low Energy Repeater

Related Posts

Building a Smart Sensor Node with a BLE Microcontroller

Building a Smart Sensor Node with a BLE Microcontroller

PIR Motion Detection using Bluetooth & STM32 Board

PIR Motion Detection using Bluetooth & STM32 Board

Updated:December 23, 20234K
Mobile App with XIAO BLE nRF52840 Sense

Send/Receive Data to Mobile App with XIAO BLE nRF52840 Sense

Updated:August 18, 20221110K
Using IMU & Microphone on XIAO BLE nRF52840 Sense

Using IMU & Microphone on XIAO BLE nRF52840 Sense

Updated:March 23, 202527K
Seeed XIAO BLE nRF52840 Sense

Getting Started with Seeed XIAO BLE nRF52840 Sense

Updated:November 26, 202412K
Home Automation Raspberry Pi

Smart Phone Controlled Home Automation with Raspberry Pi

Updated:October 21, 20222K
Add A Comment

CommentsCancel reply

Latest Posts
ESP32 Fingerprint Attendance System with Live Web Dashboard

ESP32 Fingerprint Attendance System with Live Web Dashboard

June 16, 2026
IoT Based PM & Air Quality Monitoring System using ESP32

IoT Based PM & Air Quality Monitoring System using ESP32

June 14, 2026
DIY ESP32 MLX90640 IR Thermal Camera with Live Web Display

DIY ESP32 MLX90640 IR Thermal Camera with Live Web Display

May 10, 2026
IoT Activity Tracker with ESP32 & Accelerometer Gyroscope

IoT Activity Tracker with ESP32 & Accelerometer/Gyroscope

May 2, 2026
A Guide to Sourcing Obsolete ICs for Vintage Projects

Beyond AliExpress: A Guide to Sourcing Obsolete ICs for Vintage Projects

April 21, 2026

ESP32 IoT Vehicle Motion Analyzer with MPU6050 & LIS3MDL

April 27, 2026
Building a Smart Sensor Node with a BLE Microcontroller

Building a Smart Sensor Node with a BLE Microcontroller

February 26, 2026
High-Accuracy Pitch, Roll, Yaw with ESP32 & BNO08x IMU

High-Accuracy Pitch, Roll, Yaw with ESP32 & BNO08x IMU

April 27, 2026
Top Posts & Pages
  • ESP32 Fingerprint Attendance System with Live Web Dashboard
    ESP32 Fingerprint Attendance System with Live Web Dashboard
  • IoT AC Energy Meter with PZEM-004T & ESP32 WebServer
    IoT AC Energy Meter with PZEM-004T & ESP32 WebServer
  • 12V DC to 220V AC Inverter Circuit & PCB
    12V DC to 220V AC Inverter Circuit & PCB
  • How to use ADS1115 16-Bit ADC Module with Arduino
    How to use ADS1115 16-Bit ADC Module with Arduino
  • Buck Converter: Basics, Working, Design & Application
    Buck Converter: Basics, Working, Design & Application
  • ECG Graph Monitoring with AD8232 ECG Sensor & Arduino
    ECG Graph Monitoring with AD8232 ECG Sensor & Arduino
  • Interfacing PN532 NFC RFID Module with Arduino
    Interfacing PN532 NFC RFID Module with Arduino
  • IoT Based ECG Monitoring with AD8232 ECG Sensor & ESP32
    IoT Based ECG Monitoring with AD8232 ECG Sensor & ESP32
Categories
  • Arduino Projects (197)
  • Articles (60)
    • Learn Electronics (19)
    • Product Review (15)
    • Tech Articles (28)
  • Electronics Circuits (46)
    • 555 Timer Projects (21)
    • Op-Amp Circuits (7)
    • Power Electronics (13)
  • IoT Projects (205)
    • ESP32 MicroPython (7)
    • ESP32 Projects (82)
    • ESP32-CAM Projects (15)
    • ESP8266 Projects (76)
    • LoRa/LoRaWAN Projects (22)
  • Microcontrollers (38)
    • AMB82-Mini IoT AI Camera (4)
    • BLE Projects (18)
    • STM32 Projects (19)
  • Raspberry Pi (93)
    • Raspberry Pi Pico Projects (57)
    • Raspberry Pi Pico W Projects (12)
    • Raspberry Pi Projects (24)
Follow Us
  • Facebook
  • Twitter
  • Pinterest
  • Instagram
  • YouTube
About Us

“‘How to Electronics’ is a vibrant community for electronics enthusiasts and professionals. We deliver latest insights in areas such as Embedded Systems, Power Electronics, AI, IoT, and Robotics. Our goal is to stimulate innovation and provide practical solutions for students, organizations, and industries. Join us to transform learning into a joyful journey of discovery and innovation.

Copyright © How To Electronics. All rights reserved.
  • About Us
  • Disclaimer
  • Privacy Policy
  • Contact Us
  • Advertise With Us

Type above and press Enter to search. Press Esc to cancel.

Ad Blocker Enabled!
Ad Blocker Enabled!
Looks like you're using an ad blocker. Please allow ads on our site. We rely on advertising to help fund our site.